
In week 3, we had a full day dedicated to Macros with Peter Gamble-Beresford.
As usual, I tried to follow and take loads of notes and screenshots at the same time. I needed a few hours by myself to review them all again.
Just two days later, on Friday, it was time for another weekly challenge. For week 3 , it was about…guess? Macros, of course!
The task was to create a macro in four hours and present it in the afternoon.
Some of us thought it through the days before. Some others got back to one of their applications and developed it further, or took inspiration from friends.
DS11, my cohort mates, and a bunch of sophisticated Macros
I was amazed by what the others had created.
Ellie. She worked on the datasets she had used for her application. It was a complex analysis related to her field, meteorology.
And then Andrew. He got inspired by a friend and decided to tackle some accounting calculations. For the joy of Nick.
Nick, of course, our Math nerd. Although I love Math and would like to study it in the future, at one point I lost him. His Macro was one of a kind. However, he has just delighted us with a blog post. Check it out: A Macro breakdown.
Louise. She made me think about the game Mina had showed us on the day we were first introduced to Alteryx spatial tools. Some people in the room shared with her a few phone numbers and she pulled out interesting details!
Then there was Harry, Jonathan, and, of course, Thomas.
During the training, Peter had briefly introduced us to Macro Apps.
Thomas ended up creating one. Michelin Star. He also ran it on Tableau to show which restaurants (freely inspired by our names, thanks Tom) are closest to a specific location.
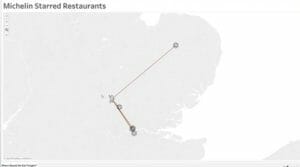
(note the Michelin guy)
My idea: A Twitter Analysis Macro
My idea was to create a macro to do a sentiment and text analysis on Tweets.
I wanted to allow the users to:
- input data taken using the Twitter API in whatever language they wanted (I later realized that APIs work in a very different way.)
- select the language
- run the Translate tool to translate the strings to English
- run a macro that provided five different types of information
- decide how to use the results:
- as a step in the workflow to continue the analysis further or
- as five different Excel files to use in Tableau.
5 things I wanted to focus on:
- Ranking of the most retweeted users
- Ranking of the most mentioned users
- Ranking of the most common hashtags
- Ranking of the most common keywords.
- Sentiment Analysis macro to embed in my macro. It would provide a score on the expressions and words used in the Tweets. I’ve left this part on the side for now.
How to create the Twitter Analysis Macro in Alteryx
My dataset
To test the macro, I could have used some dummy data or downloaded a list of tweets using the Twitter API. As I said, I gave up on the APIs. We still need to learn them.
I went directly to Kaggle and downloaded a dataset from there.
I thought about something weird that had happened in the past. What came to my mind was the day the Government of India removed ₹500 and ₹1000 bills from night to day. As foreigners, it was a puzzling experience, but we ended up dealing with it with a smile.
In rural areas, however, I read about the big problems some people had faced. We are talking about 1.3 billion people all at once.
So, there it was, a dataset on 8 November 2016, also known as the 2016 Indian banknote demonetization. Or, for us, the time when we put down roots in front of ATMs.
I couldn’t find the answers I wanted for the rural communities I was interested in. They would write in local languages. Writing on Twitter wouldn’t be their first daily priority. A well-structured survey for a policy evaluation would have served the purpose.
However, the point of building a macro is that it should be applicable to all kinds of datasets taken from Twitter.
This was my first test.
Here are the steps:
1. Open 2 workflows in Alteryx:
- workflow 1 and
- the Macro workflow.
2. Drag the same file onto both panes.
The Input Data tool will appear on the pane.
Let’s focus on the Macro workflow for now.
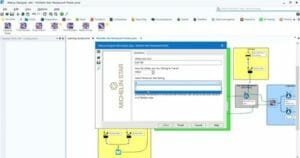
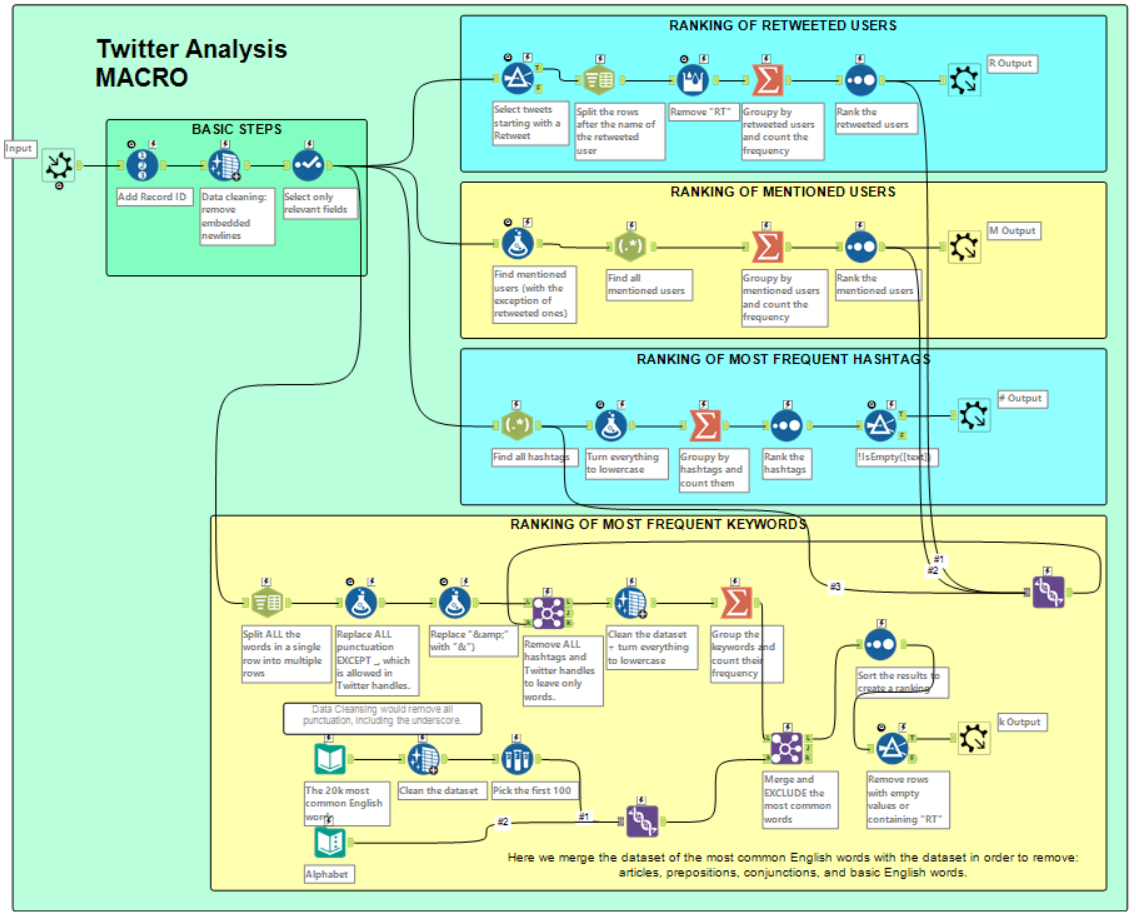
This is what it looks like (it’s still a work in progress!):
Note for beginners, like me. To keep the different flows separate, you can add Comment tools in the background. To do that, drag the Comment tool on the pane and change the format (Font, size, background color, etc.). Then right-click and select Send to Back.
Otherwise, select a bunch of tools with the mouse, right-click, and select Add to New Container. The selected tools will now appear in a specific container, which you can name and customize with a background color.
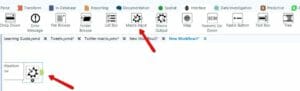
3. Right-click on the Input Data tool and select Convert to Macro Input.
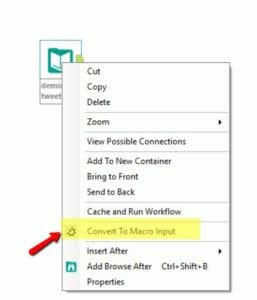
4. The Input Data tool will turn into a Macro Input tool.
If you look at the toolbar, under Interface, all the basic Macro tools appear. The Macro Input is one of them.
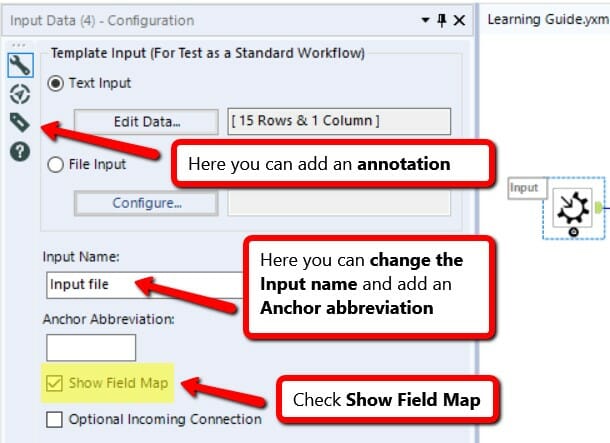
5. Click on the Macro Input and look at the Configuration Pane on the left. Check Show Field Map.
6. Basic steps:
– Add Record ID. For this kind of analysis, I ended up not needing it, as I couldn’t use it after the Summarize tool in each workflow. However, I left it in case I might want to do something different later on.
– Add Data Cleansing to remove embedded newlines.
– Add Select to select only the relevant fields. The original file in Kaggle came with several columns that I didn’t need. My focus was only on the Text column and its long strings (the tweets).
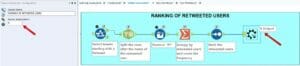
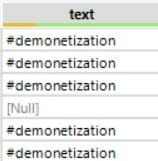
7. Ranking of Retweeted Users
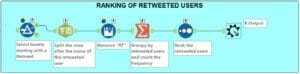
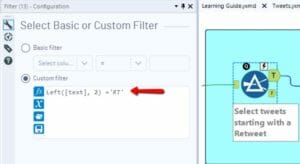
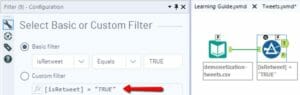
- Select only the Retweets. Add a Filter and select the tweets that start with RT OR select the tweets for which the column IsRetweet = TRUE.
Or
- Split the tweet after the name of the retweeted user.
The structure of the text in the cell is as follows:
“RT @username: rest of the tweet.”
The retweeted usernames are always followed by “:”, so I can use it as a delimiter.
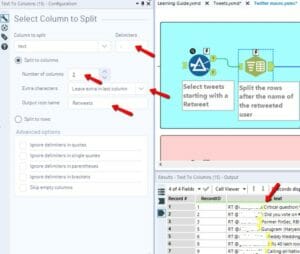
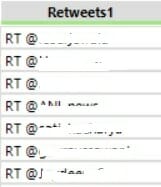
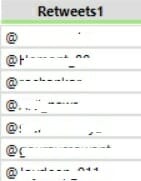
- Add a formula to remove “RT” from the cells.
 ==>
==> 
- Add Summarize to group by retweeted users and count their frequency.
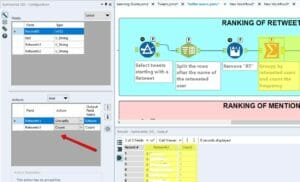
- Add Sort to rank Count in descending order, from maximum to minimum frequency.
![]()
- Add the Macro Output. This way, the users are free to output the data the way they want.
Remember to add an Anchor abbreviation as well. It can only be 1 letter or symbol.
Why?
Once we add the final macro to the other workflow, the macro icon will have 4 different outputs on the right. Each one of them will allow you to output data about retweeted users, mentioned users, hashtags, and keywords.
In the Macro description, you will have to guide the user and explain which letter refers to which answer.
The four anchor abbreviations will be:
R, M, #, and K.
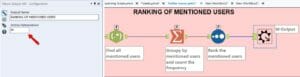
8. Ranking of Mentioned Users
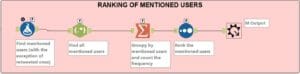
Now I want to collect all the mentioned usernames in both the tweets that are retweets and the normal tweets. So, I:
- Add a Formula to select only the tweets that are not retweets.

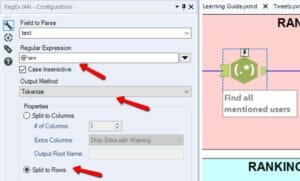
- Use Regex to find all mentioned users (@username). Split to rows in order to have all the users in the same column.
- Same as above: Group by mentioned users and count the frequency. Rank them.
- Add Macro Output and type M as Anchor Abbreviation.
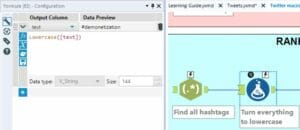
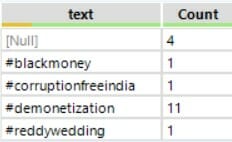
9. Ranking of Most Frequent Hashtags
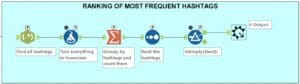
- Same as above: Use Regex to find all hashtags (#hashtags). Split to rows in order to have all the hashtags in the same column.
- Add Formula to turn every hashtag to lowercase.
 ==>
==> 
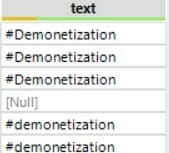
This step will be useful when you:
- Add Summarize to group by hashtags, and use Sort to rank them by frequency. There might be several hashtags for the same word (uppercase, lowercase, toggle case or with a capital letter). If you count their frequency, you want them to be recognized as one.
 ==>
==> 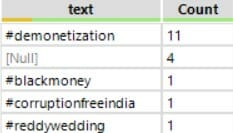
- You can see that there are a lot of Null values. Add Filter to add the custom filter: !IsEmpty([text]).
This will remove both null and empty rows.
![]()
- Add Macro Output and type “#” as Anchor Abbreviation.
10. Ranking of Most Frequent Keywords
This one is the trickiest!
COMING SOON in another post!
**************************
Photo credits: ID 14463939 © Sebastian Czapnik | Dreamstime.com