After an intense—and startling—first week at the Data School, I had some time during the weekend to go through all my notes about our first five days of training.
We covered a lot, from a deep dive on the Data School vision and approach, to some Alteryx basics and great talks, to Friday’s presentations and welcome drinks. And ping pong, of course. Right, Jonathan?
Nick has already done a great job here putting all the pieces together in one of his first blog posts.
But what better way to look back at Week 1 and start practicing than trying to create a timeline viz about it?
So, here goes.
A rewind back to my first steps learning time and dates in Tableau and . . . my very first—and very speedy—video about DS Week 1!
Andy’s CV and my first timeline idea
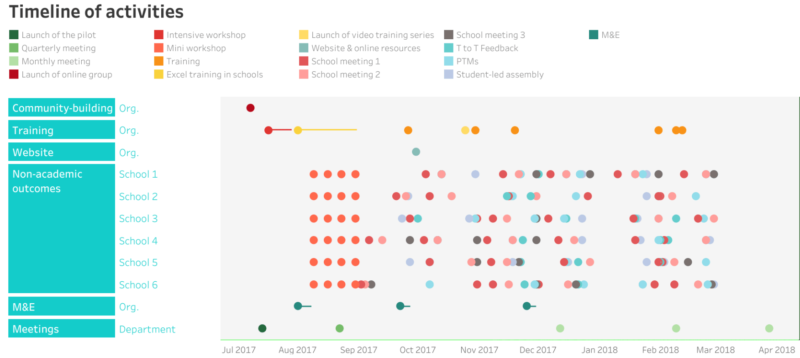
Back in January/February, in the middle of creating my first dashboard for our pilot project, the DS blog and Andy’s “Data Viz Done Right” came to the rescue several times.
I was almost finished with my very long dashboard when I came across Andy’s About page.
I loved his way of using a viz to share his professional path. I seized the chance to learn some more Tableau tips and tried to add a timeline of activities to my final work.
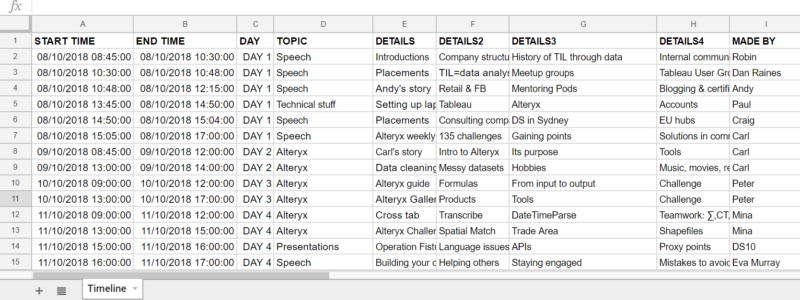
What does a timeline’s dataset look like?
As a beginner struggling with every new chart, getting the dataset right was quite a treat.
Fast forward a few months, and this old viz gave me some useful tips for what I had in mind.
Here’s how the dataset for DS Week 1 looks:

A timeline of activities . . . done differently
My idea was to show each event scrolling on the screen as if it were a promotional slideshow.
To do that, I needed to set both the Start and End dates as DateTime variables.
After some iterations and playing with the workbook, I ended up with something quite similar to my original sketch on paper. I was quite satisfied!
If you want to have a look at it on Tableau Public, here it is.
A beginner’s efforts, waiting for the next badge to unlock
After a week of Alteryx, its Weekly Challenges, a daily encounter with Tableau Zen Masters, and expert data gurus all around me, I’m well aware that it will take time to move from beginner to intermediate—and who knows when—to advanced.
For now, however, I enjoy my little wins and hope to refine my previous vizzes with some brand new remakes.
Friday was Presentation time. Afterward, it was great to hear Amanda Patist share her first efforts and her versions 2.0.
We are all going to learn, look back, and want to make our previous work better.
It’s nice, though, to see how each one of us is adding one more piece to the puzzle and bringing forward new ideas to add to the technical foundation that we’re going to build over the next four months.
I’m ready for the challenge and look forward to combining these ideas with everyone, every day.


