Today we had a slightly shorter amount of time to complete out dashboards due to a really interesting visit from James Eiloart, Tableau SVP for EMEA. He spoke to us about the history of Tableau and where he sees the software platform in the current marketplace, which we were really pleased to come to terms with again in 2018.3, but first had to overcome an Alteryx wall of building a whole analytic app in 4 hours.
Data Preparation
Time restraints directed us to split up creating the analytic app between us; I hadn’t much experience of apps so I decided to work on the middle part of that with Nick, which was the call to Coord, while Kirsty, Lily and Conrad did the front end of the app with the calls to Google Maps Places API to search for the geometries of location, and Ellen and Gheorghie worked out how to correctly load this into a Tableau workbook.
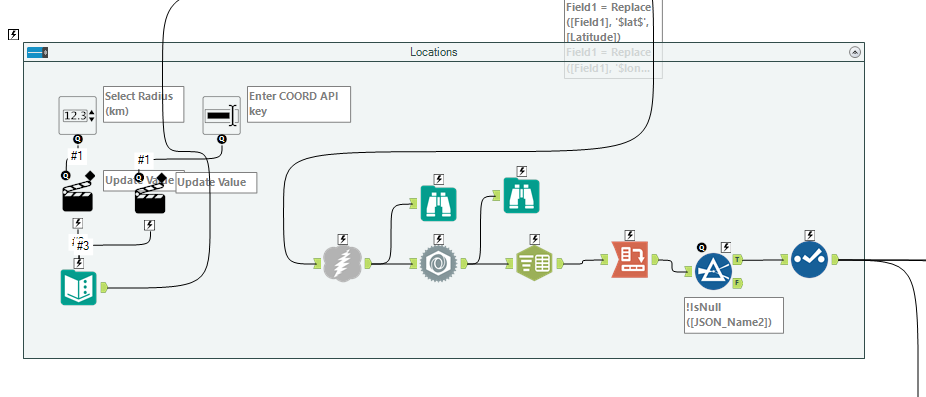
Focusing on the middle part, the call to Coord was in two pieces – first to call the location of bikes near to the geographic coordinates as specified in the Google Maps Call, and then formatting the GeoJSON data it returned into something that we could use in Tableau. Nick thought it would be helpful to call the billing data for each service as well but this was not something that I could get to work, so I didn’t use it in my resulting viz. As the result was ultimately an analytic app, there are macro inputs to change the radius and our respective Coord API keys in order to create the search patterns we wanted.
Data Visualisation
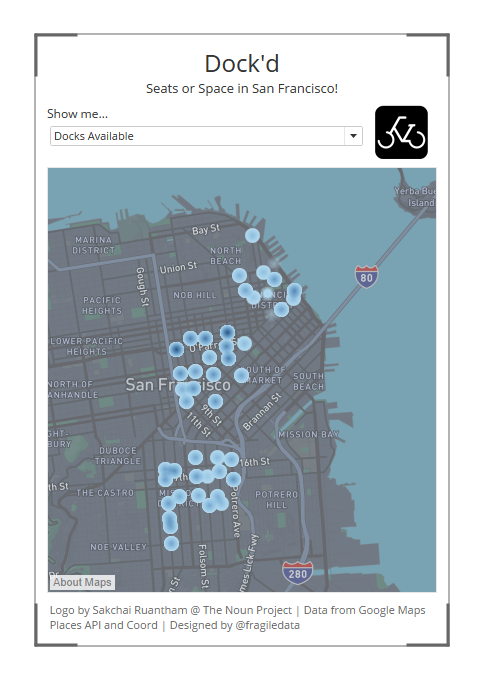
Dock’d, coming soon to some VC conference near you.
The results back from Coord are a list of the availability and location of cycle docks within San Francisco at the time the call was made. I decided to try out some item’s I’d never done before with this, by using a custom map from Mapbox (which Ellen can tell you about), and by using different device layouts for a dashboard – as ultimately the app should run in real time, I decided to create a phone and tablet layout for my viz. Lastly, I also chose to try out the new heatmap feature in 2018.3, to somewhat questionable effect, and made up some branding (“Dock’d”) to amuse myself after a long afternoon fiddling with APIs in Alteryx.
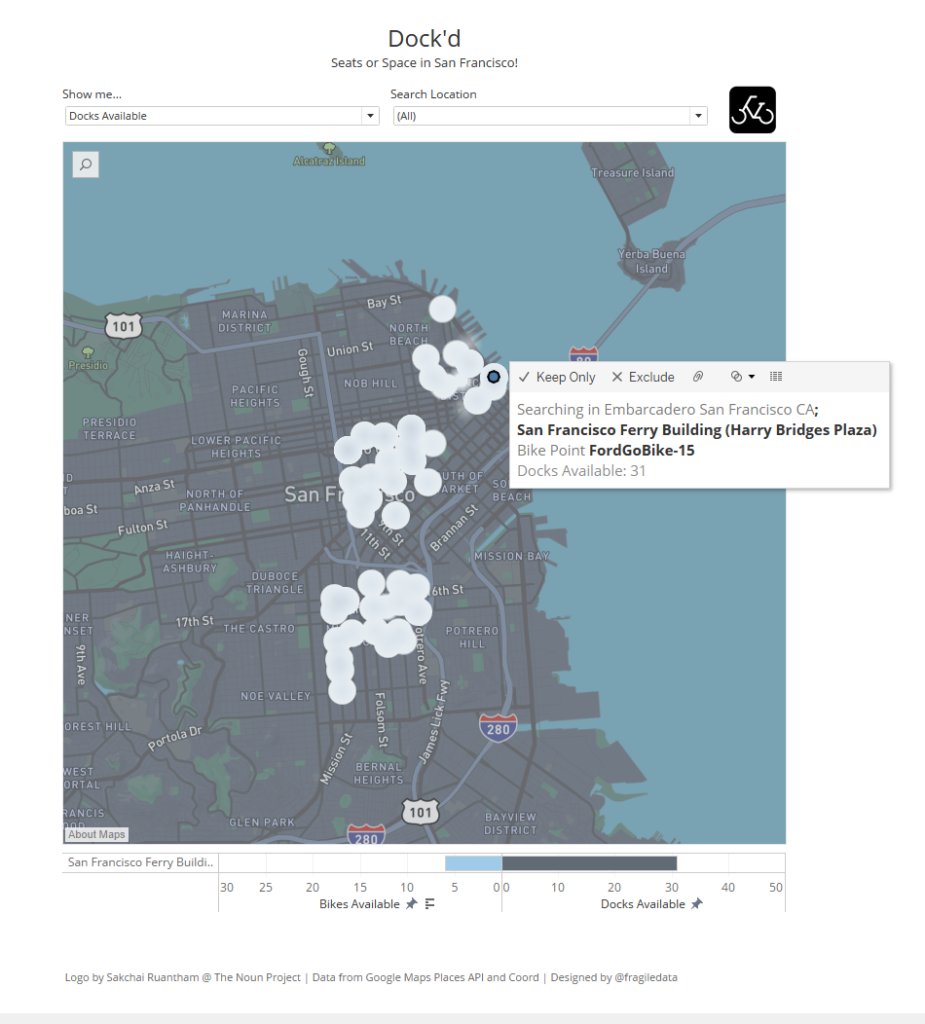
Also available for iPads!
You can view the interactive version (not sure what happened to the fonts) in Tableau Public here.
