From its foundations in R, Alteryx can support quite advanced predictive modelling from a variety of data sources. This week, we learned how to create three kinds of predictive models in Alteryx (Regression, Classifiers and Forecasts) so this blog post is going to discuss creating classifier models. Classifiers are essentially representations of probability – how likely is it that object A will belong to category A, B, or C – with the models determining the best way this difference is represented in the features of the data. An example workflow using the Iris data set is below. This data set is very commonly used to demonstrate classification type tasks (and also clustering, occasionally) in data science.
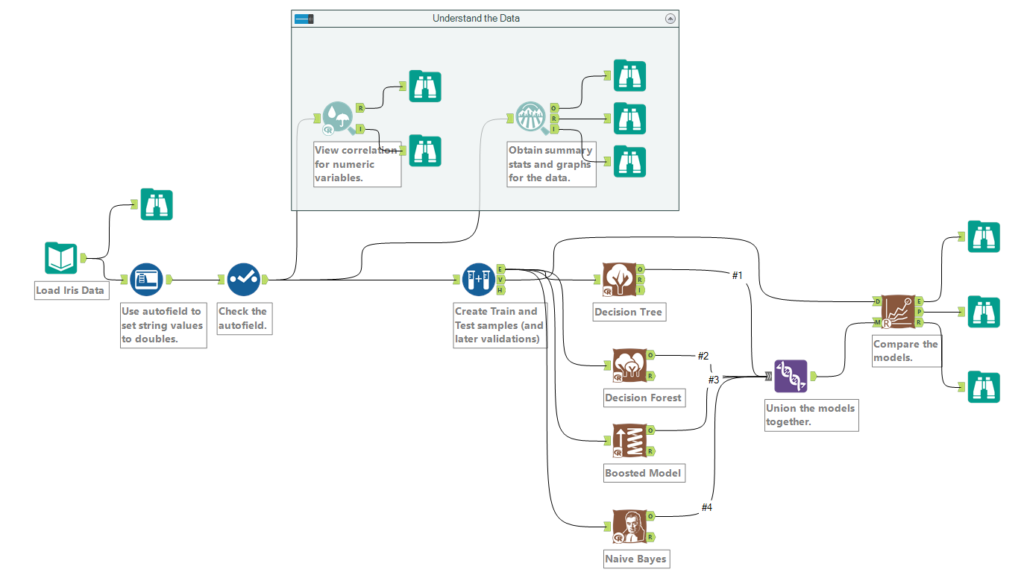
A basic classifier flow in Alteryx.
Great! Looks understandable to anyone, not just those with several hours of scowling through R code. Having said that, there are things to watch out for with classifiers, which is partly why this flow is full of binoculars;
Explore your data first: look at the metadata of your data set, as well as a good idea of its general statistics and shape. This will eventually help you understand how well the classifier is working! This is particularly important when your categorical field is represented by digits (e.g. numbers correlating to a product category), as using the auto field tool may switch these to a number format, instead of keeping them as strings. Below is a correlation matrix of the features of the Iris data set, showing how features match against one another.
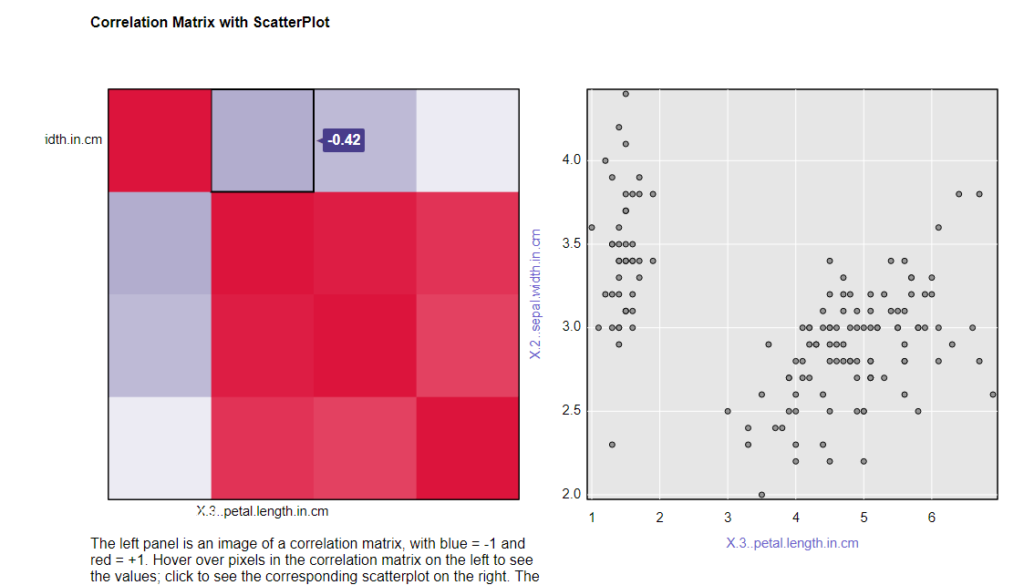
The scatter plot is particularly helpful to give more detail about how a correlation plays out in the data set.
Use different models: Alteryx makes it quite easy to run multiple models on a data set, but more importantly, using the ‘Model Comparison’ macro from the Alteryx gallery makes it really easy to see which one is the best! Those with academic backgrounds reading this may be wishing for the clarity of something like an SPSS readout to exist (though “clarity” may not be the right word), so Alteryx joins this information to confusion matrices,which are integral to understanding where your model may have tripped over something in the data. Though the font is fuzzy below, the confusion matrix makes it clear to see that while the models generally did very well, the Decision Tree confused Virginica for Versicolor three times, and Versicolor for Virginica once.
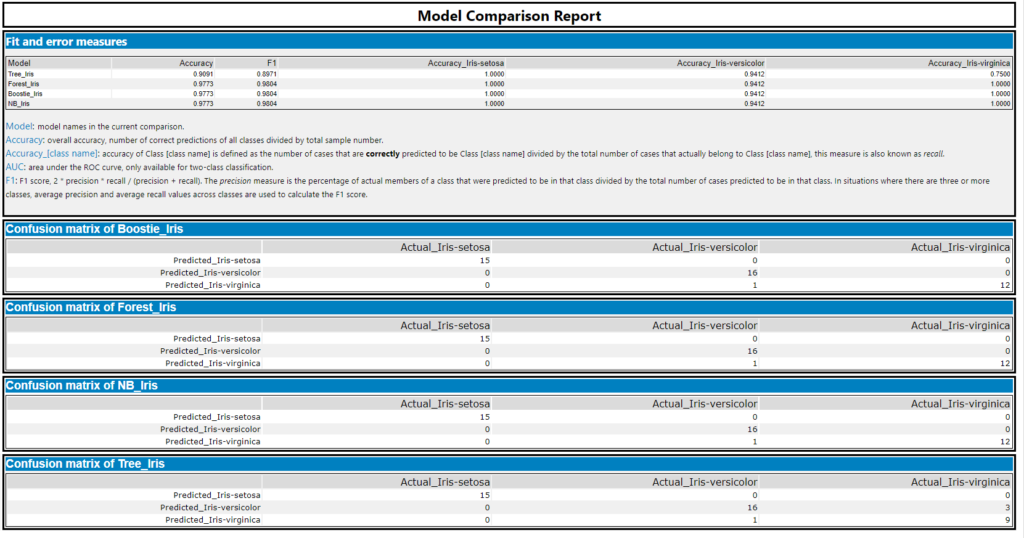
Output from the Model Comparison macro.
That’s the core of classifier models in Alteryx. Classification models are at the heart of many efforts in data science and machine learning across a variety of industries, but there is no need for them to remain mysterious!
