


For the first week, the challenge was to recreate a visualization using Tableau's Superstore Sample Data to show year-over-year purchase frequencies. The challenge had some specific things to figure out.
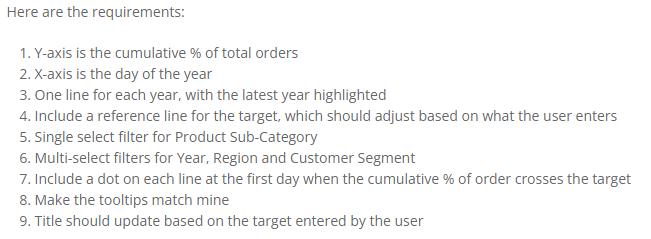
Before we get into calculating the percentage of total orders, let's find a way to calculate the day of year.
Datepart() is a great tool for this. The different datepart options include 'year', 'month', 'day', etc. For this case we're specifically looking for 'dayofyear'.
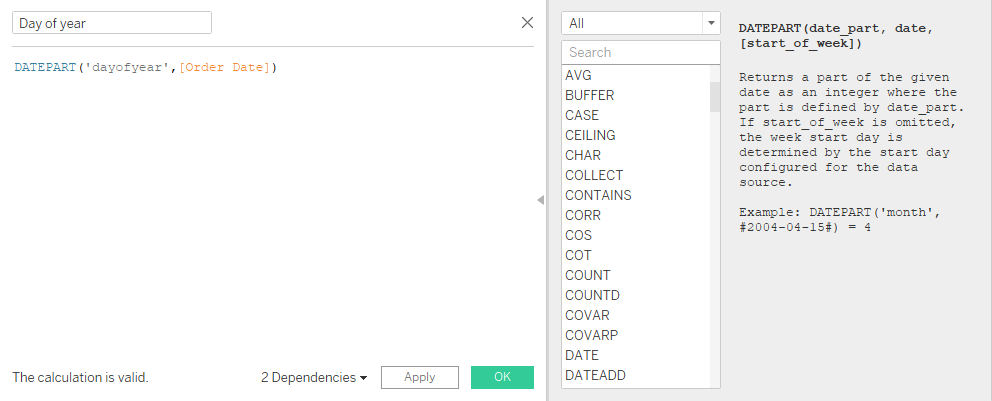
Datepart will give you a discrete dimension, which is not what we want. In order to edit the x-axis so it only shows intervals of 50, we first need to convert our Day of Year to continuous.
Next we calculate the percentage of total by dividing the number of Order ID (that will be calculated per Day of Year) with the total number of Order IDs in the whole data set. It also needs to be a running sum, so that it adds the next day to the previous day until it gets to the last date in the data set. Since we're looking at the percentage of total, the final value should be 100%.

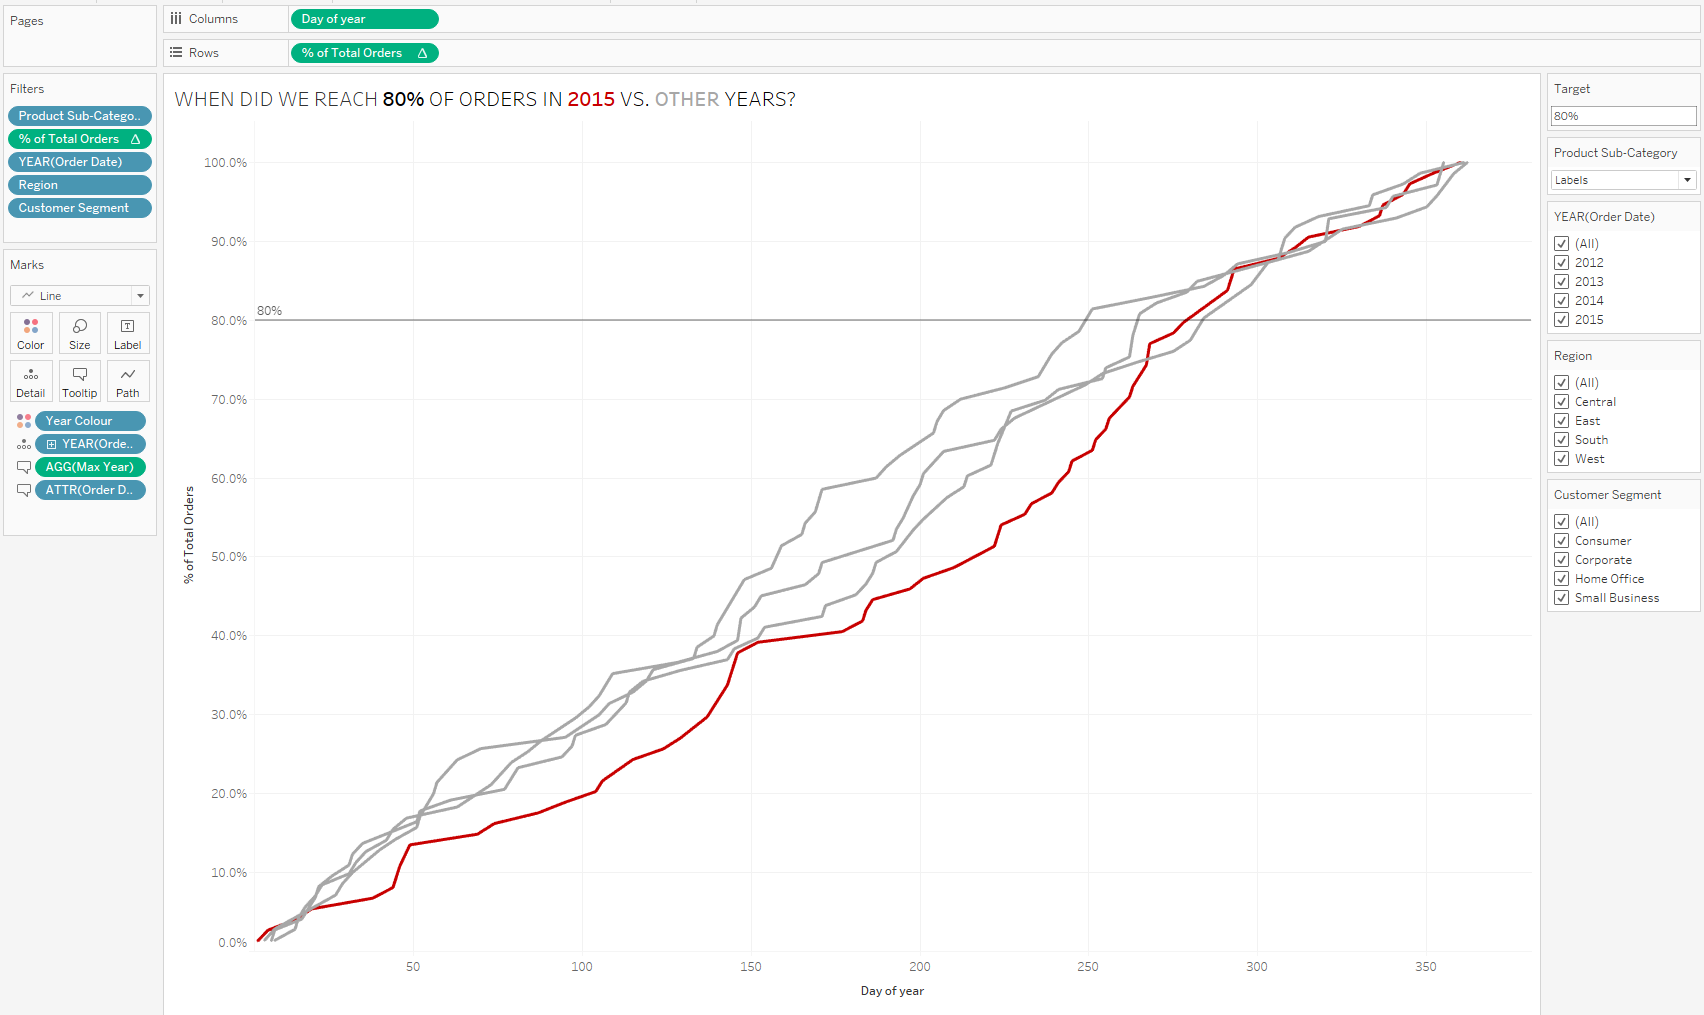
We end up with one line on our chart. To split the up into the different years, you add the year of your Order date to the detail mark.
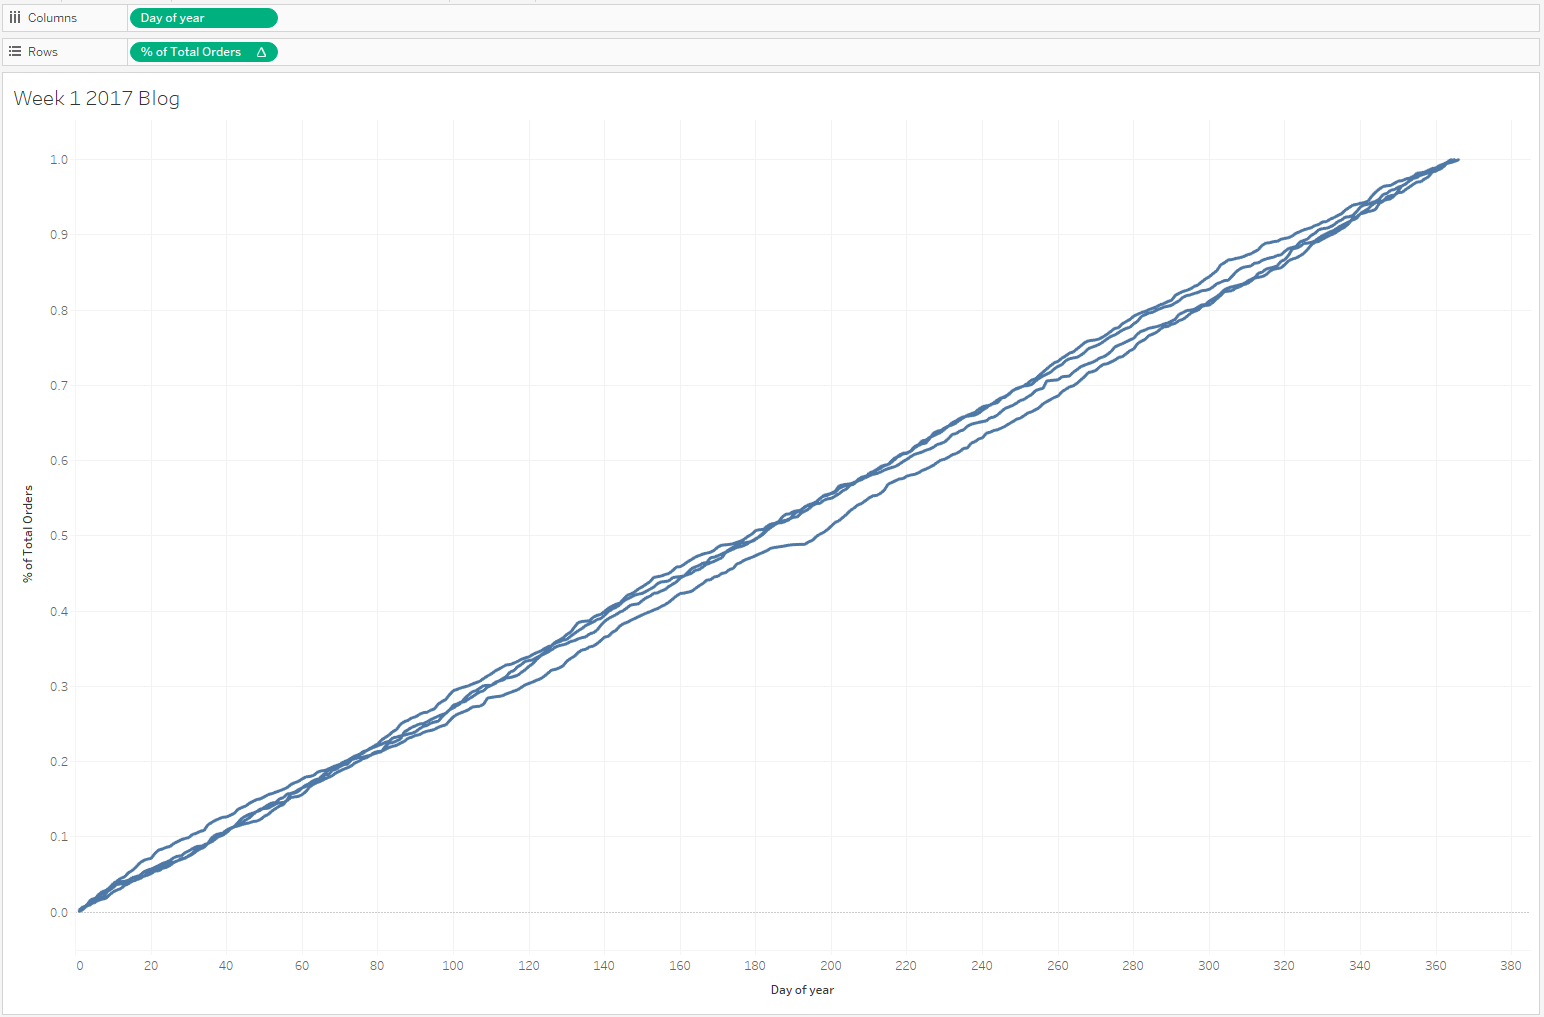
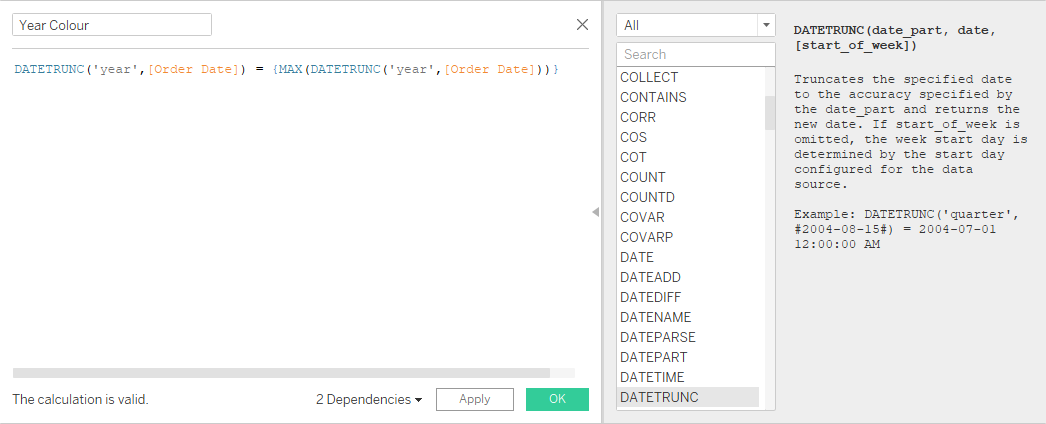
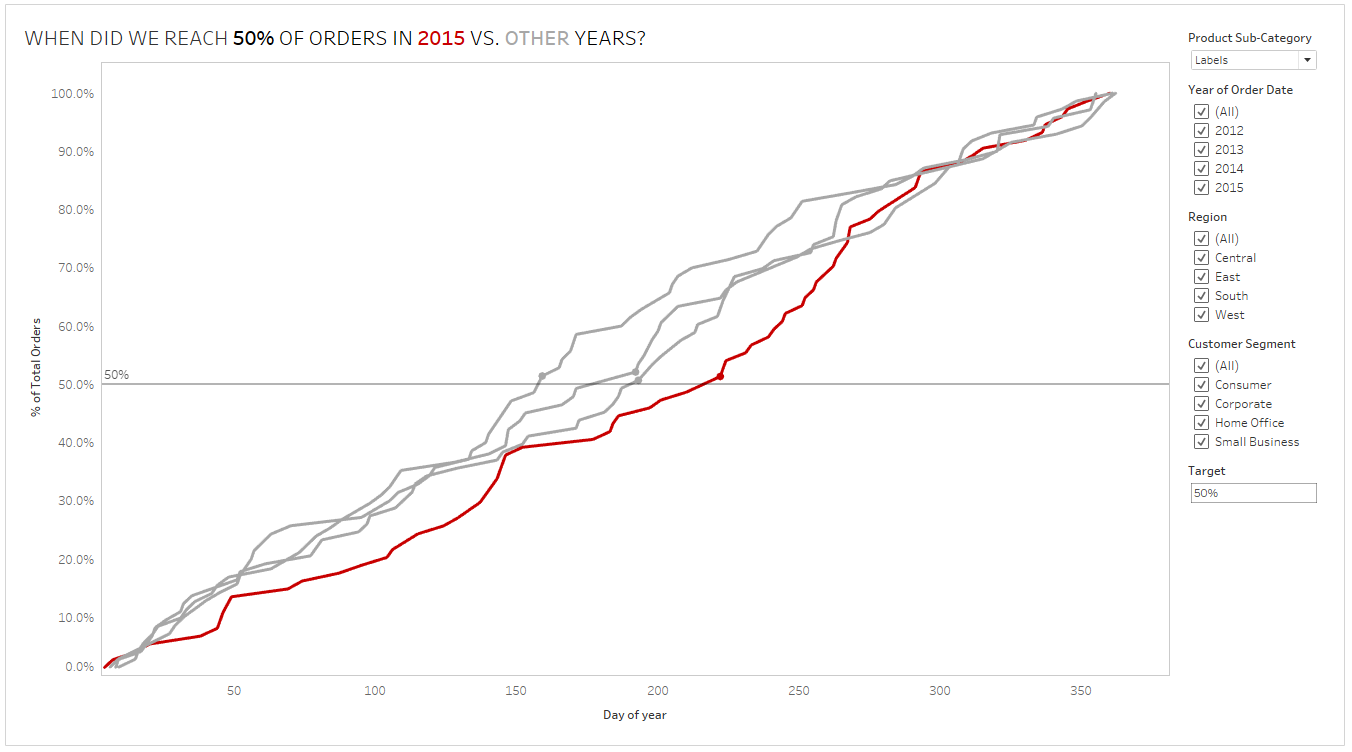
To highlight the latest year, we'll need a calculated field. In this case, a simple Boolean statement will highlight the latest year one colour and the other years a different colour. We use Datetrunc() to get just the year of the Order Date and compare it to the Maximum year in the data set. If the chosen year is equal to the latest year, it will be true. Adding that to the colour mark will allow you to specify the red colour for True and the grey colour for False.
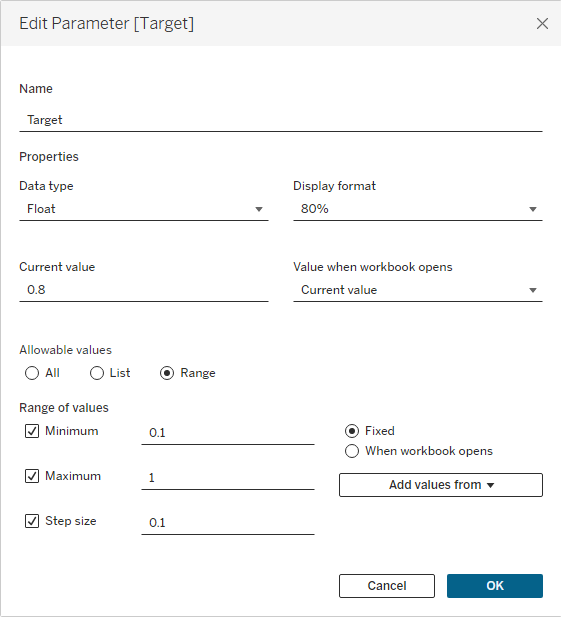
Adding an adjustable reference line that your user controls requires a parameter. Specify the data type as a float because you want your user to type decimal values within a range of 0.1 to 1. You can change the display format so it displays as a percentage and not a decimal value.
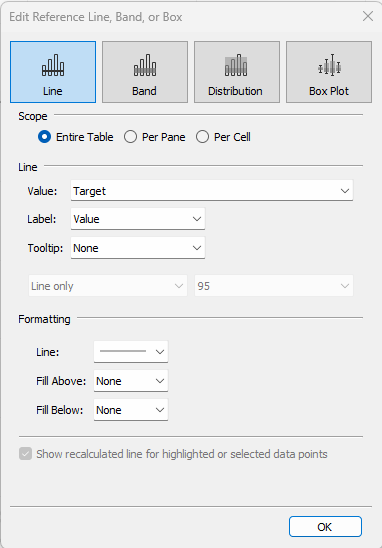
When you add the reference line to your sheet, specify the Target parameter as the value. After adding the parameter, the filters are next. We add all the filters that are required to the sheet and format them where necessary.
Number 7 was where things got a bit tricky... To show only one dot on the line chart you could make use of dual axis and create a chart showing only one day. However, making it dynamic so that it updates to show the first day after the target specified by the user, was a challenge for sure.
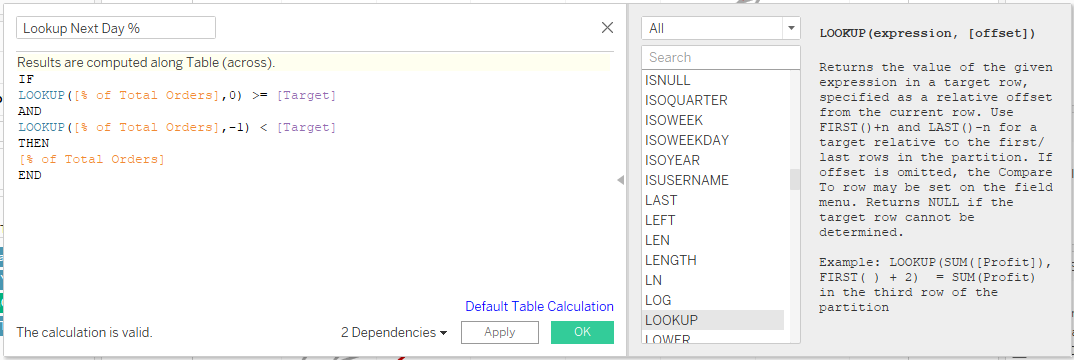
I couldn't quite figure it out myself. I tried using the LOOKUP() function to look for the next entry after the target, but I couldn't get it to just show one entry after the target, it showed all entries for the rest of the year.
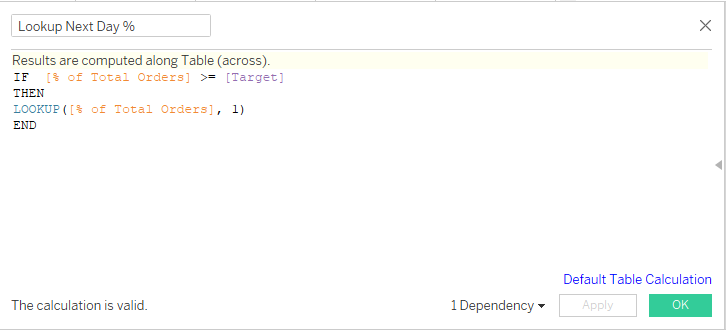
So I went in search of help and found this solution by https://bit.ly/Charlie_Hutcheson. Charlie does a great job of explaining two different ways to calculate it - either use a window minimum function or a lookup function. We end up with an if statement that compares the lookup value to the target, if the value is more than the target and the previous entry is less than than the target, then we want that value.
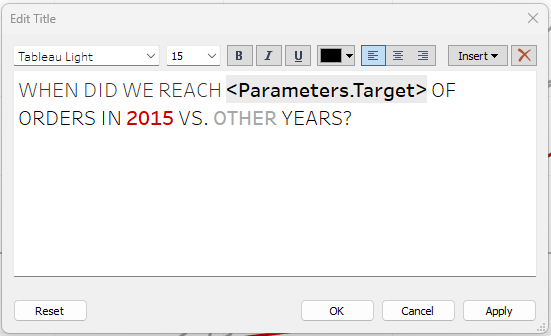
What's left is formatting the chart and tooltips according to the requirements. To make the title dynamic so that it updates as you change the target, you place the target parameter in the title.
The final result is a dashboard that shows the year over year purchase frequency
https://public.tableau.com/app/profile/lorraine.ferrusi/viz/WOWWeek12017_16975033794990/WOWWeek12017