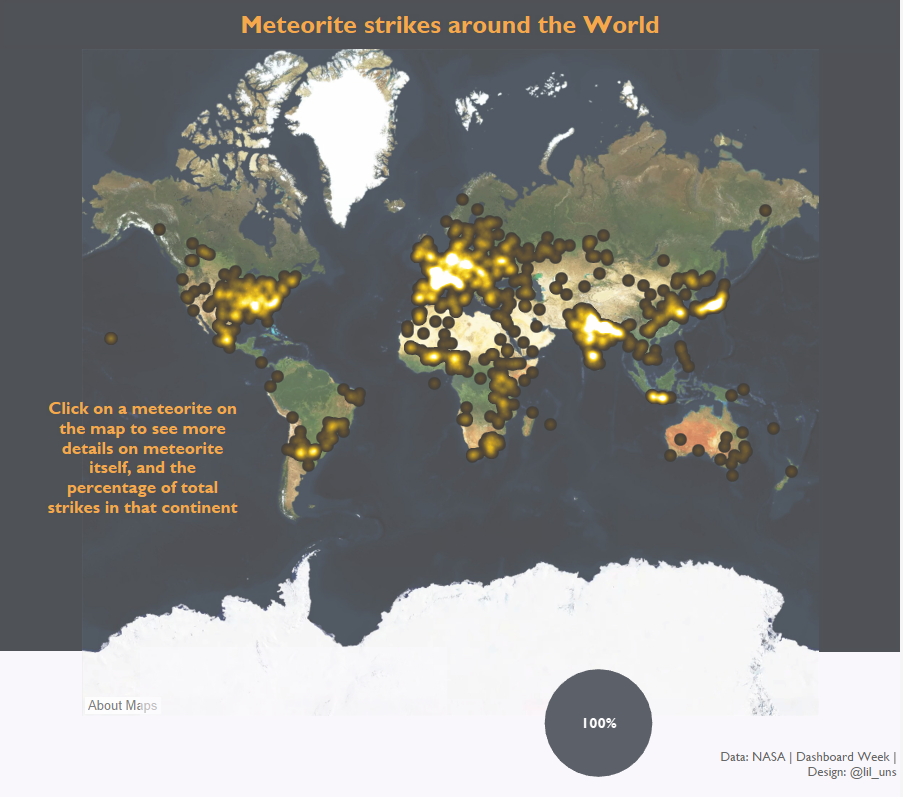
1000 meteorites + 4 hours + 2 new features = 1 final day.
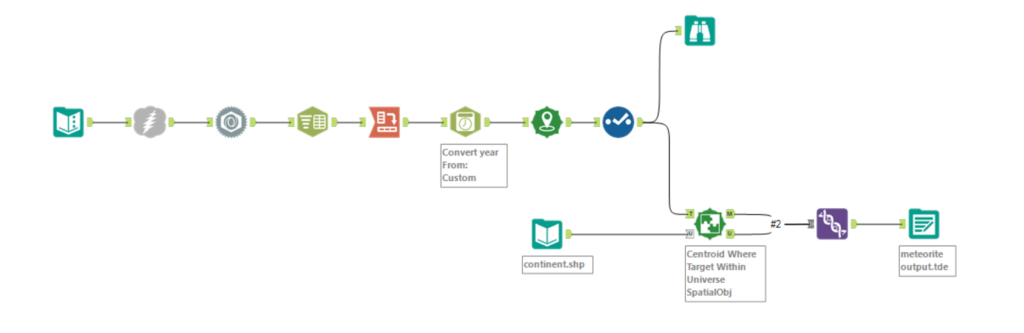
The data for today came from NASA and looked at Meteorite landings for the last 1000 or so years. Andy specifically said there was no Alteryx involved, so the first thing I did was open Alteryx to download the data and parse it out from the JSON format which the API provided. I then found a spatial file which had continental spatial objects. I used a spatial match to combine the two, and around 30 records fell out as a result of the meteorite strike having no latitude or longitude. I unioned the two outputs and put it all in a tde for Tableau.
Why did I include the continents? So that I could create a set action. I wanted to allow the user to view the breakdown by continents when they clicked on an individual meteorite strike, much like Bethany Lyons did in Ready, Set Action at the Tableau conference. It was a little confusing to create my first set action, but it’s a pretty useful output, even if meteorites ain’t your thang. Thanks to Sasha for walking me through it.