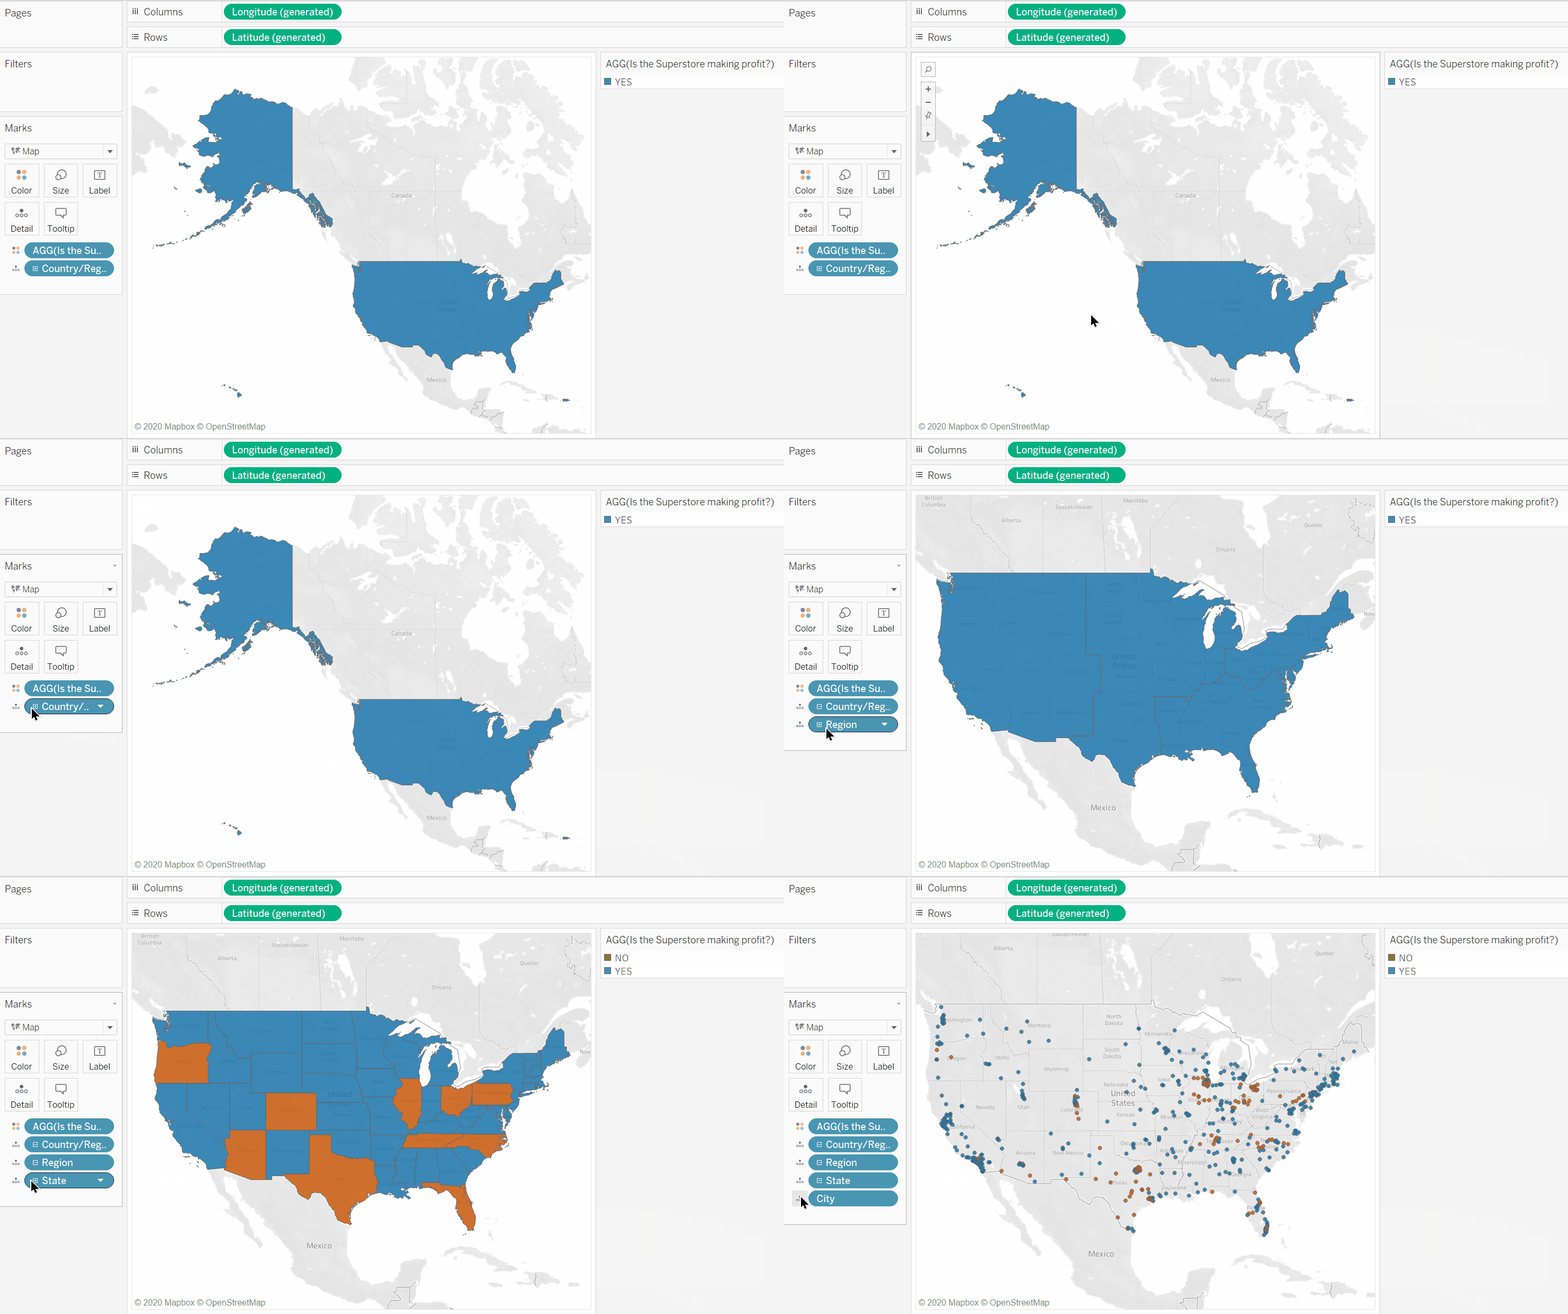
In order to quickly breakdown the profit across a region, we can use the hierarchy feature in Tableau to drill down and increase the granularity.

As seen above, we can drill down to see which states aren’t making the Superstore profit and by further drilling down we can get an indication of which cities aren’t making profit. This can be useful in the beginning of data investigation since we can observe, at a glance, where we might want to concentrate our analysis.
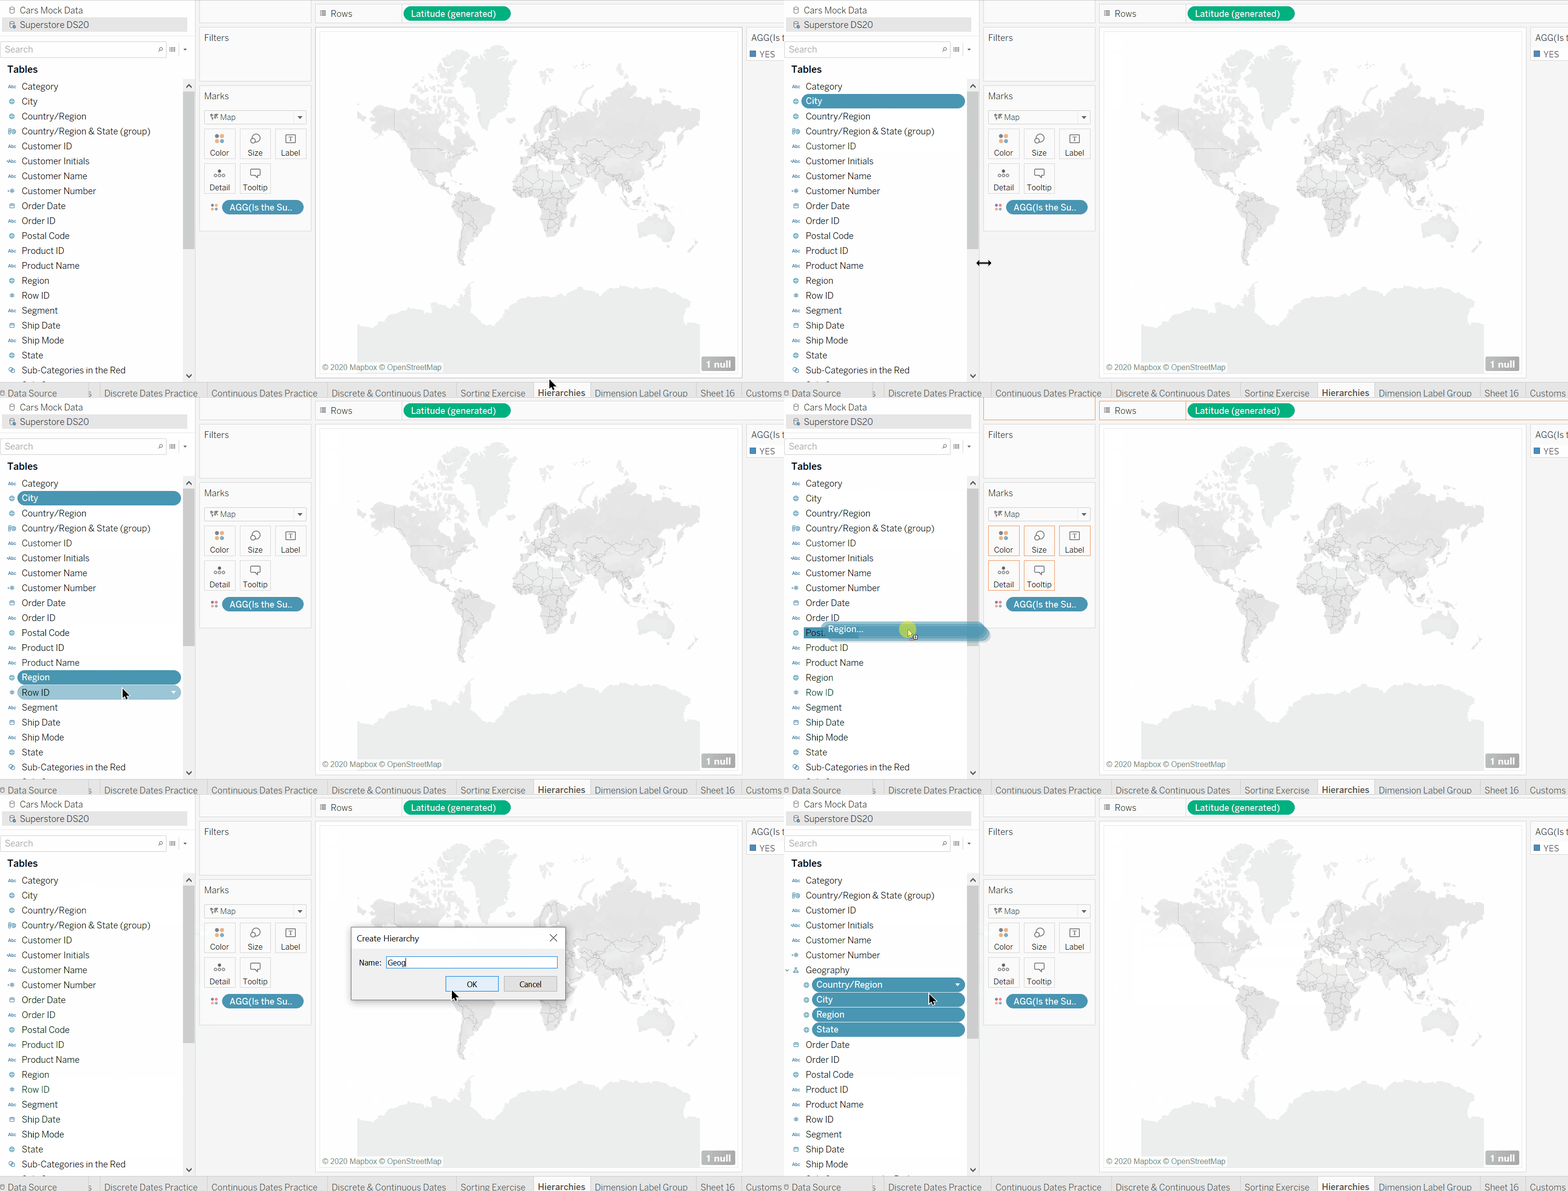
To create a hierarchy, simply select the fields that you want to include and drag them into the field at the top of the hierarchy. In this case we drag the fields into Country/Region because USA (part of this field) contains the regions, states and cities.

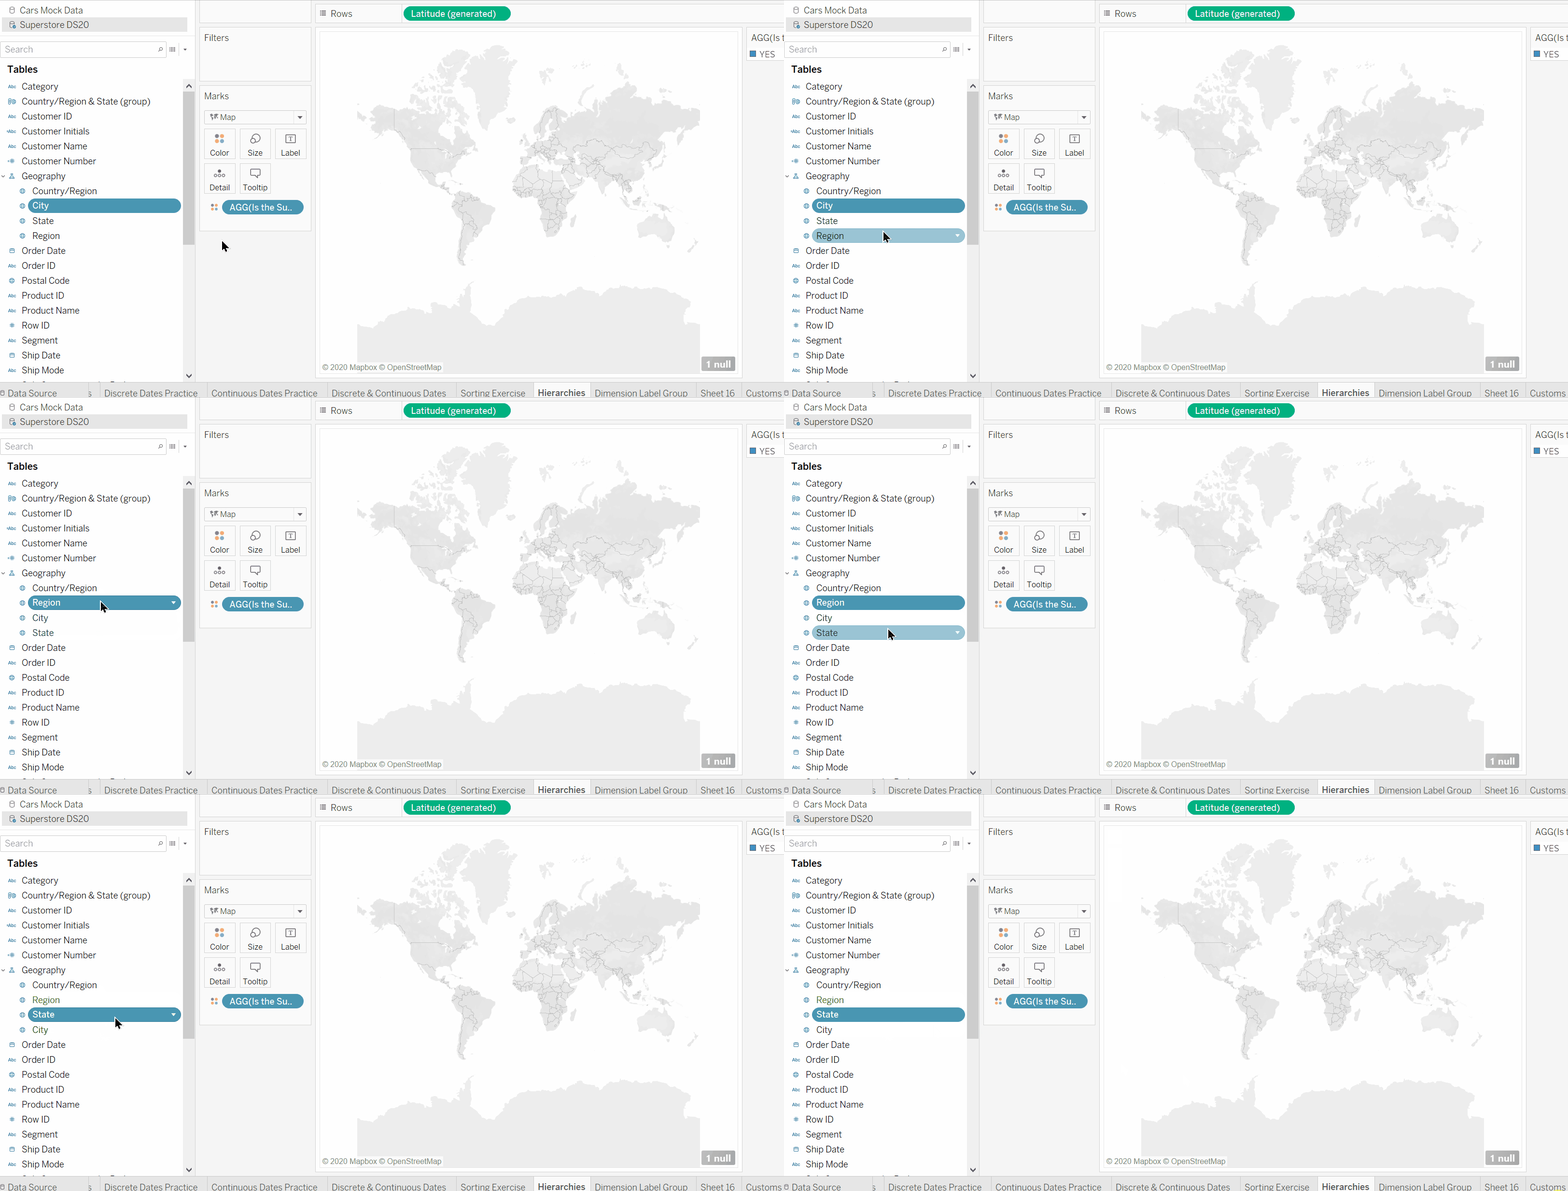
Then simply rearrange within the field’s pane so that drilling down become easy. The order Country > Region > State > City makes the most sense here.

Done!
