User filters on Tableau server are an excellent way to control individual access to certain information. These filters may be applied to specific dimensions of data to produce a sub-sectioned table that only includes data associated with the user. Using Superstore data as an example, let’s say a set of users should only be able to see data from their own segment and region when looking at a workbook on server.
A fantastic way to manage access rights is with a dedicated excel file, an example can be seen below:
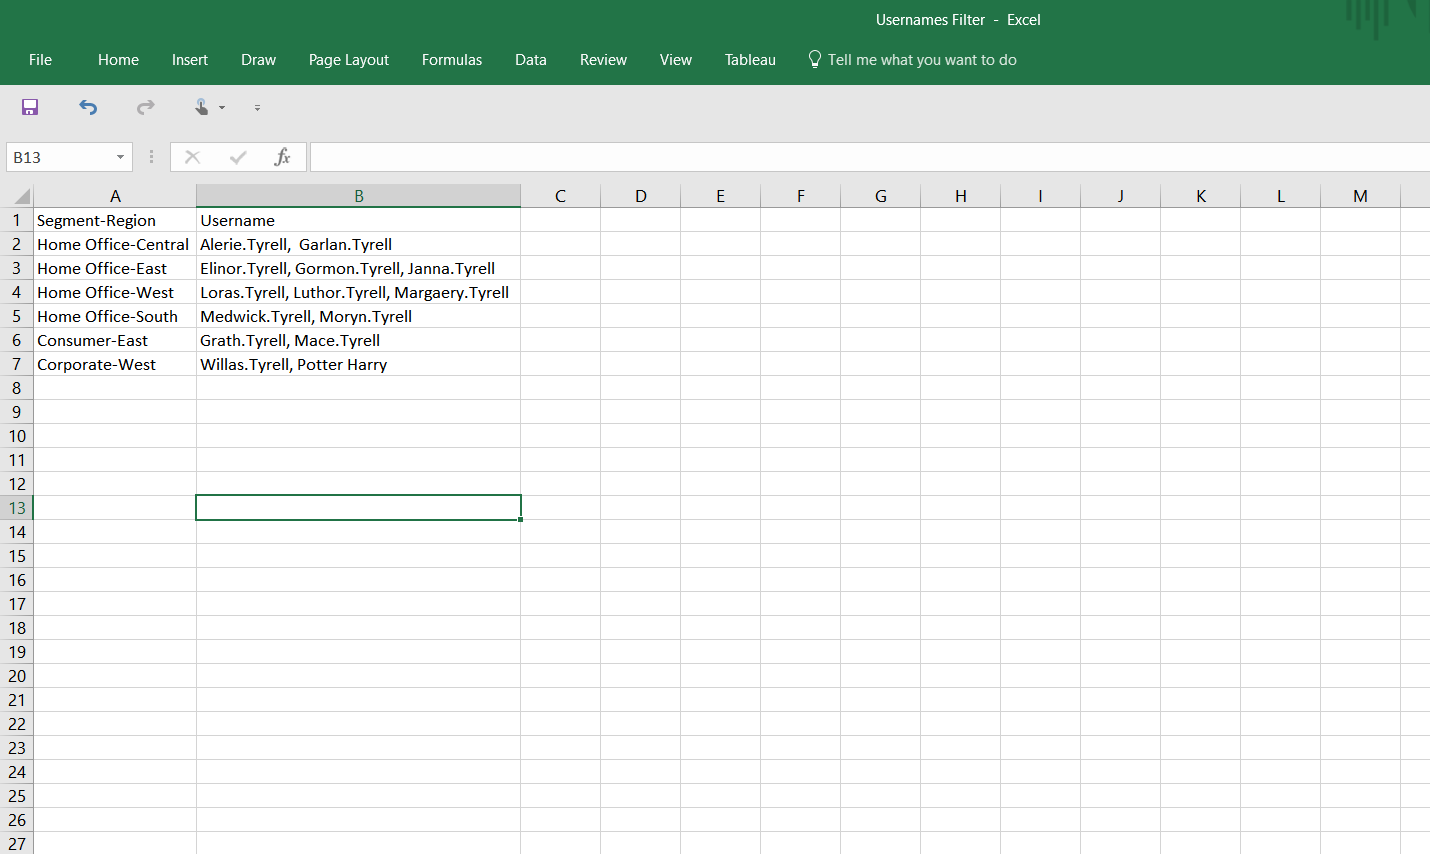
This file acts as a simple central-point to manage users. It can be updated to add or remove users as necessary. In the Superstore data, the segment each user works in and the region they cover are two separate dimensions, however, here in this file, they are combined within the same field and so there is no common field to join on. Nevertheless, this can be accounted for when joining the two data sets in Tableau. The beauty of this method though is that it allows for filtering by multiple dimensions at once, which is necessary as the users have two dimensions associated with their job role.
Notice also that, in the example above, the usernames have been listed in the same field per segment-region incident, separated by commas. Accounting for multiple users in the same segment-region via this method, rather than creating a new line per user, prevents duplication of rows after joining to the Superstore data.
To bring these two pieces of data correctly a calculated join is required:
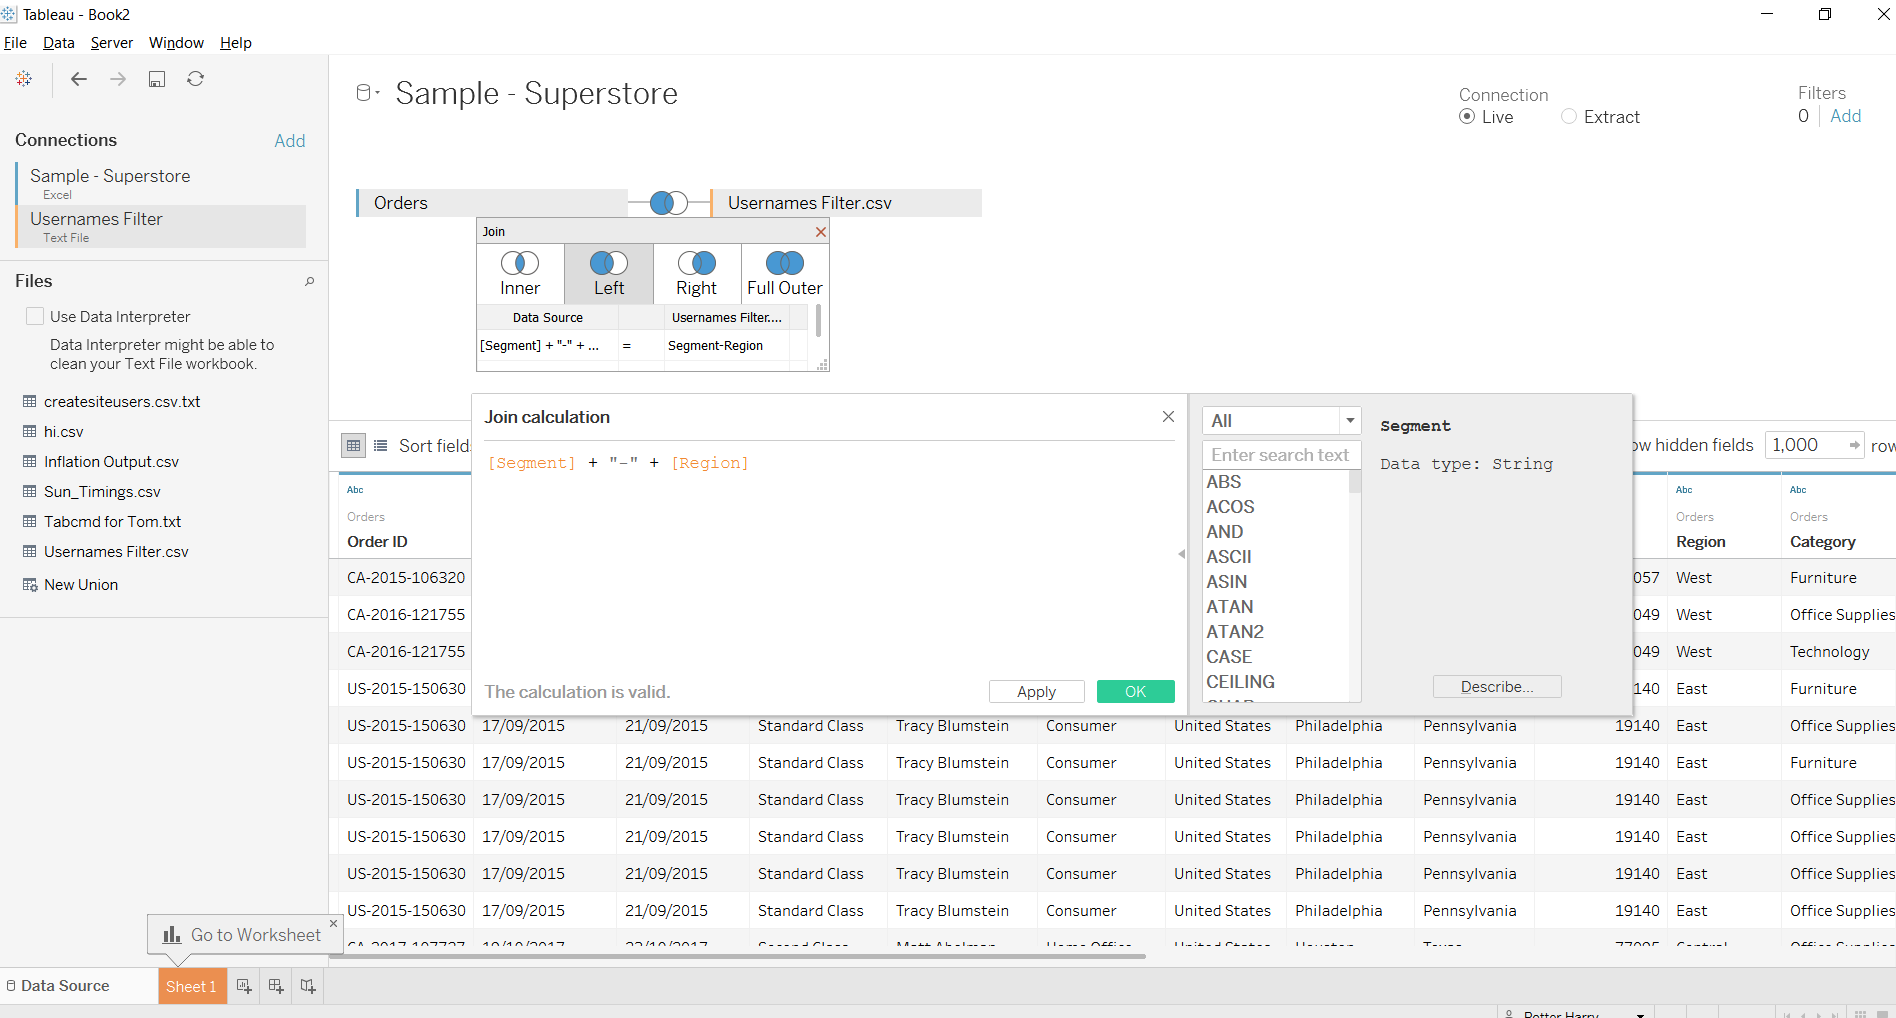
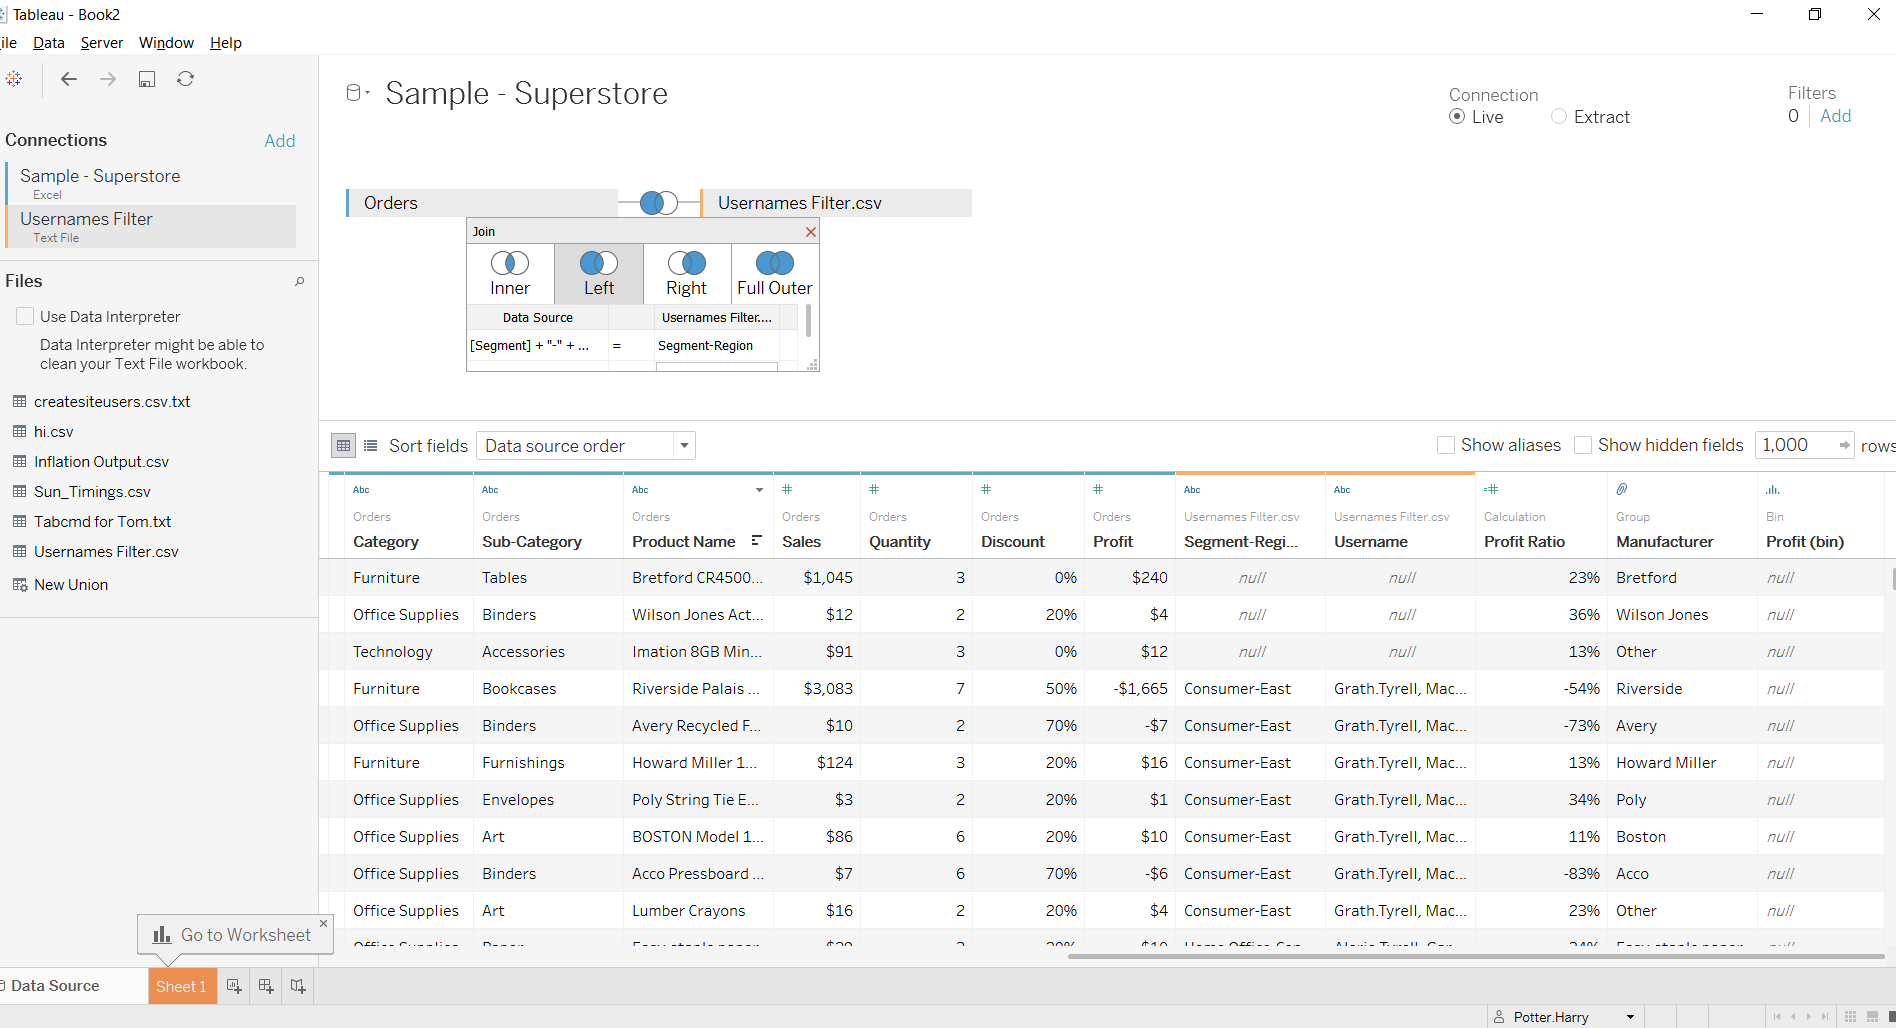
This calculation is basically telling tableau to join segment-region from the usernames data to Superstore data when a row contains both the matching segment and region. A left inner join is used to keep the unmatched Superstore data. The results of the join are seen below where users have been matched:
Next, a calculated field is required to pick a username out of the list of users in each row:
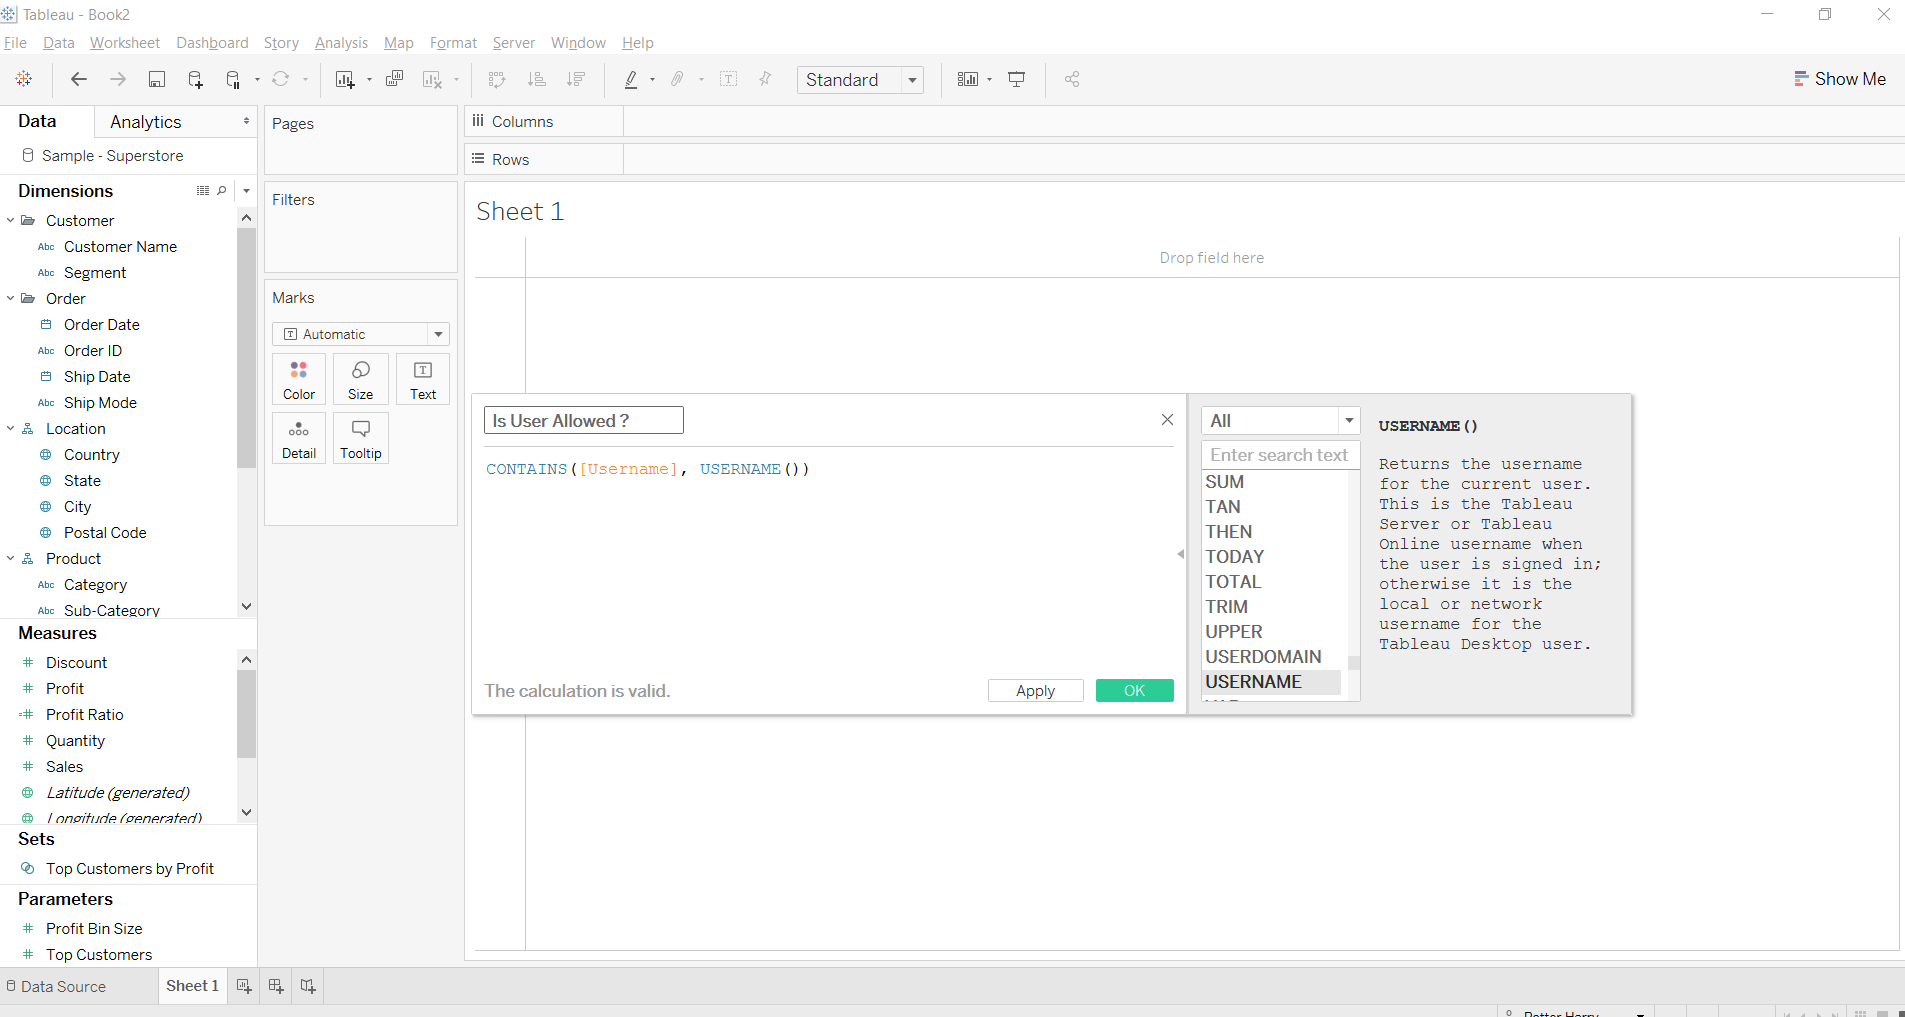
This Boolean calculation is asking Tableau to look for the username of whoever is logged in to server, in the list of names which is the username field of the joined data. If the logged in username exists in the row of data it is returned. If not, the row is not returned and thus the filter is applied.
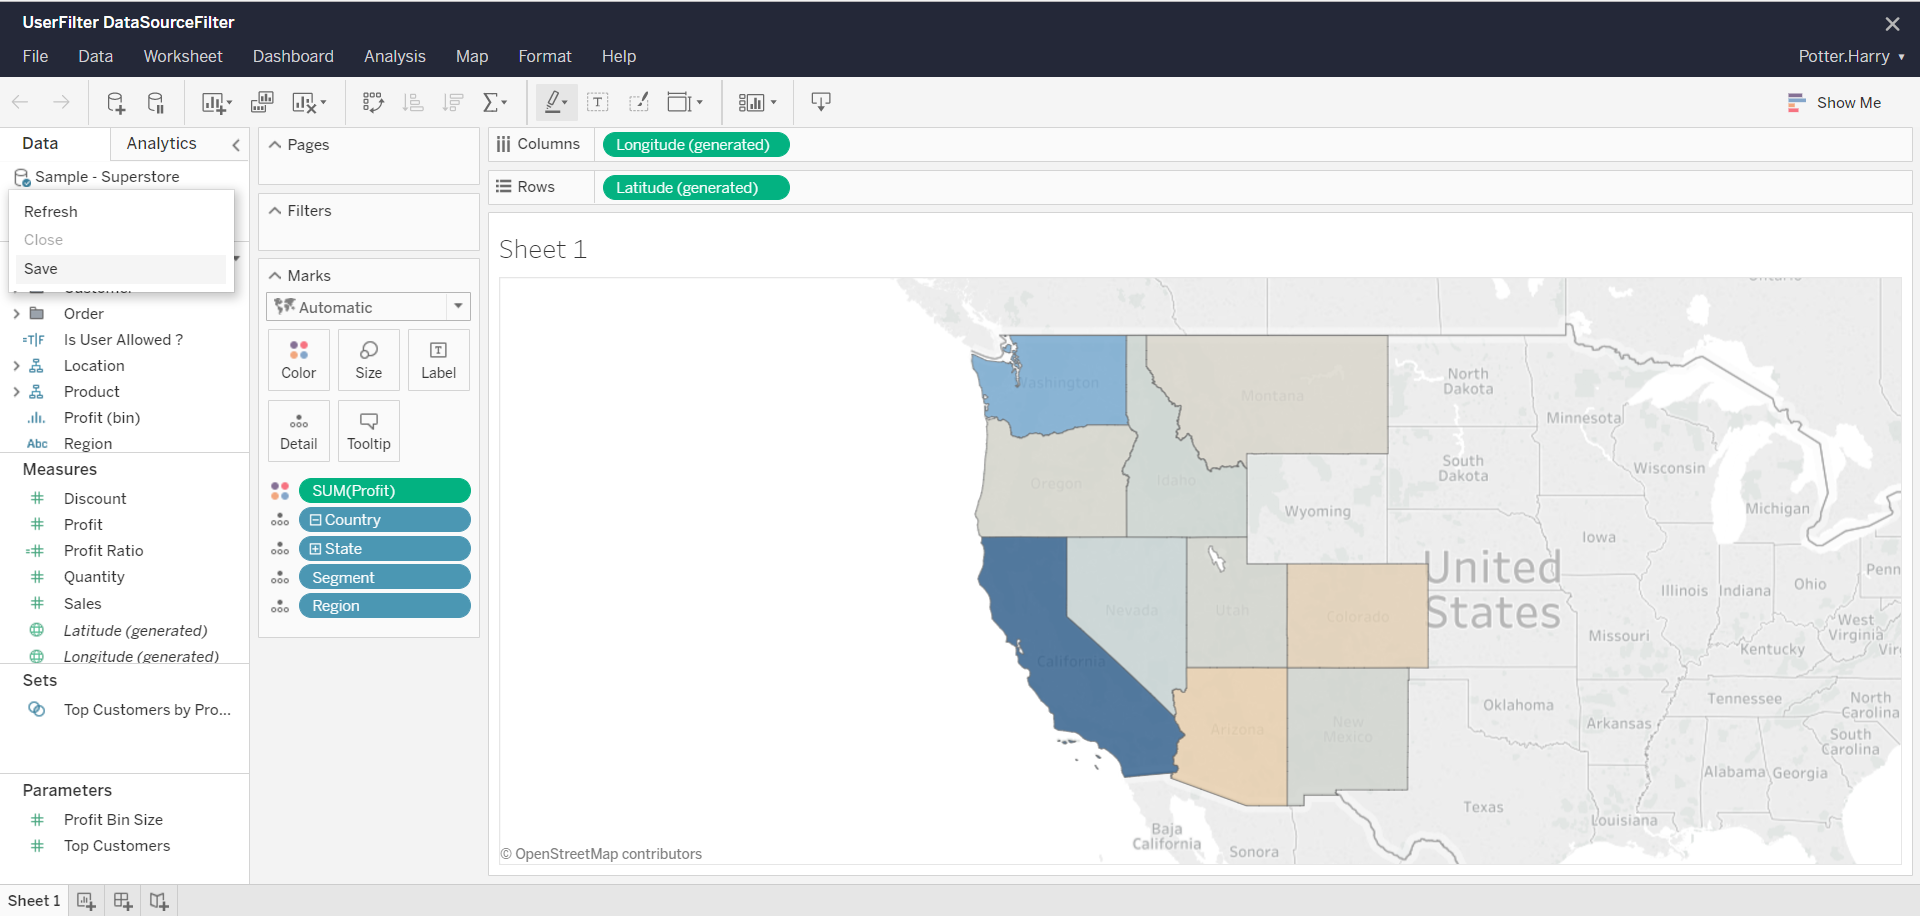
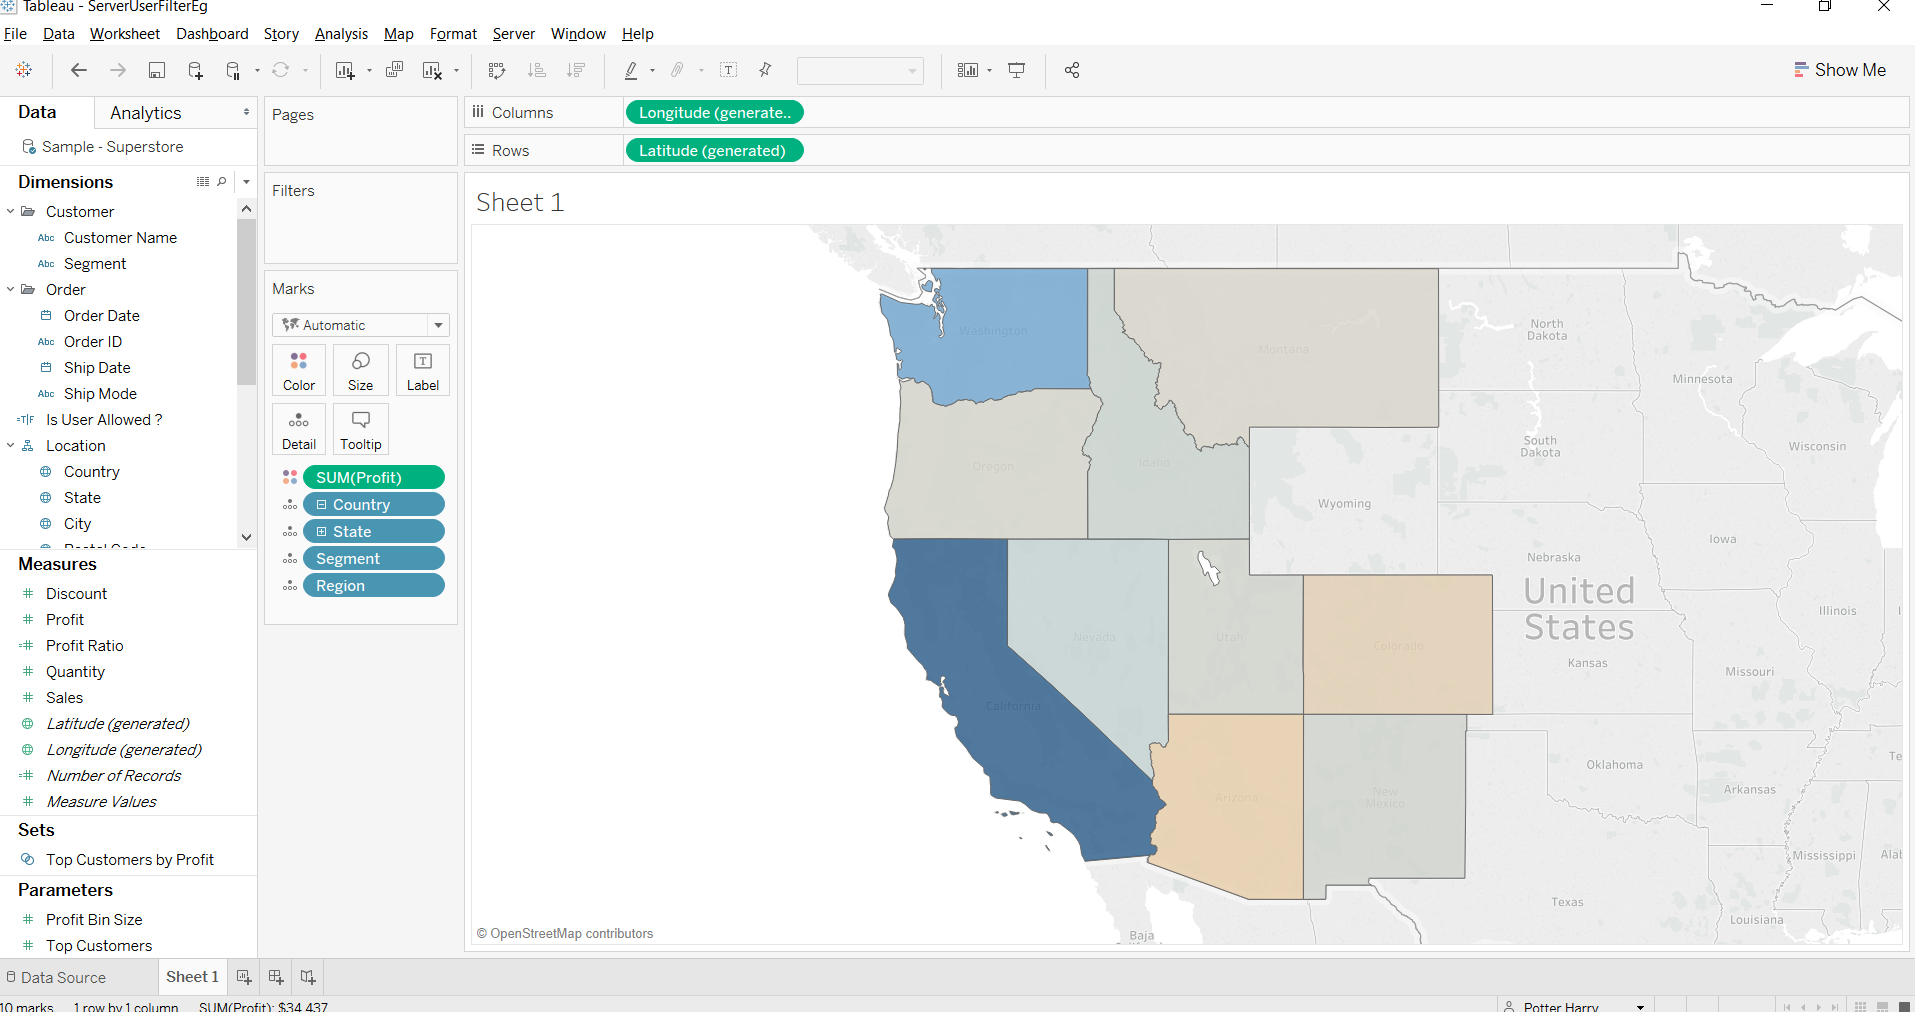
In the example pictures below the steps taken to apply this calculation can be seen followed by the filtering it produces:
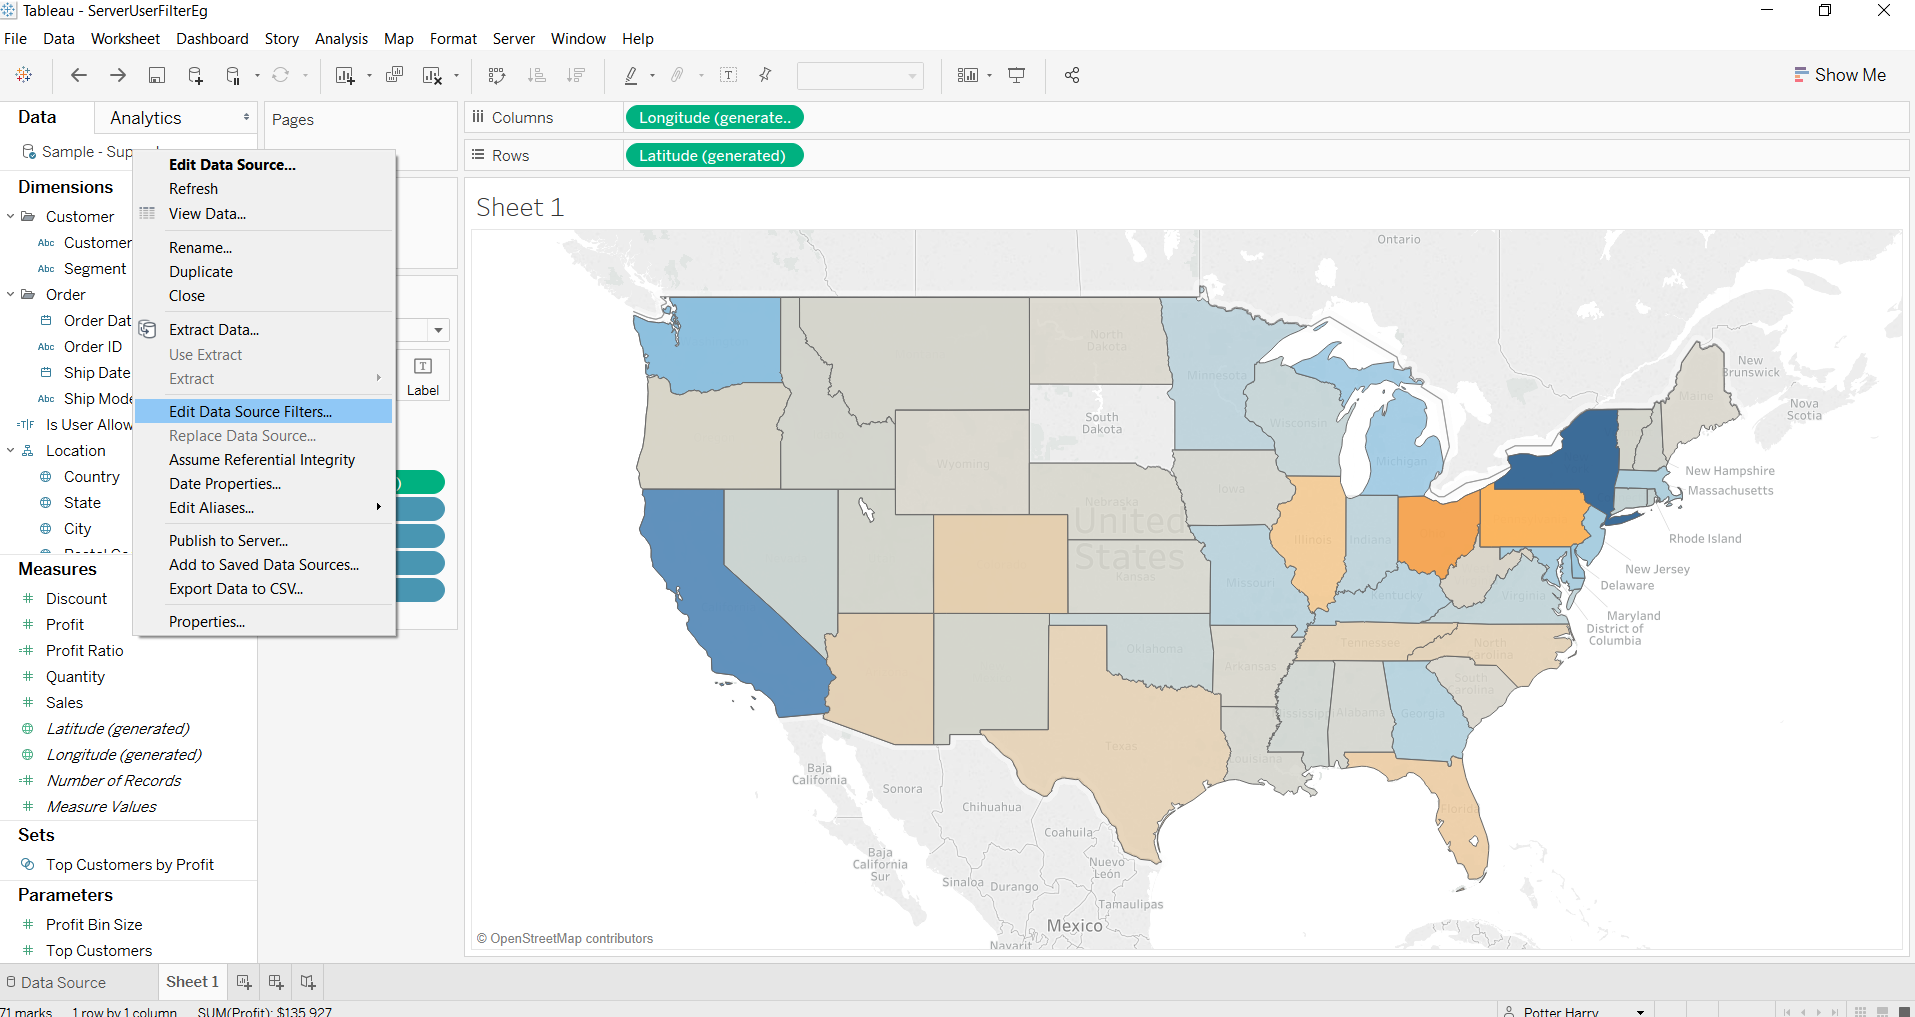
First, right-click on the data source and select edit data source filters:
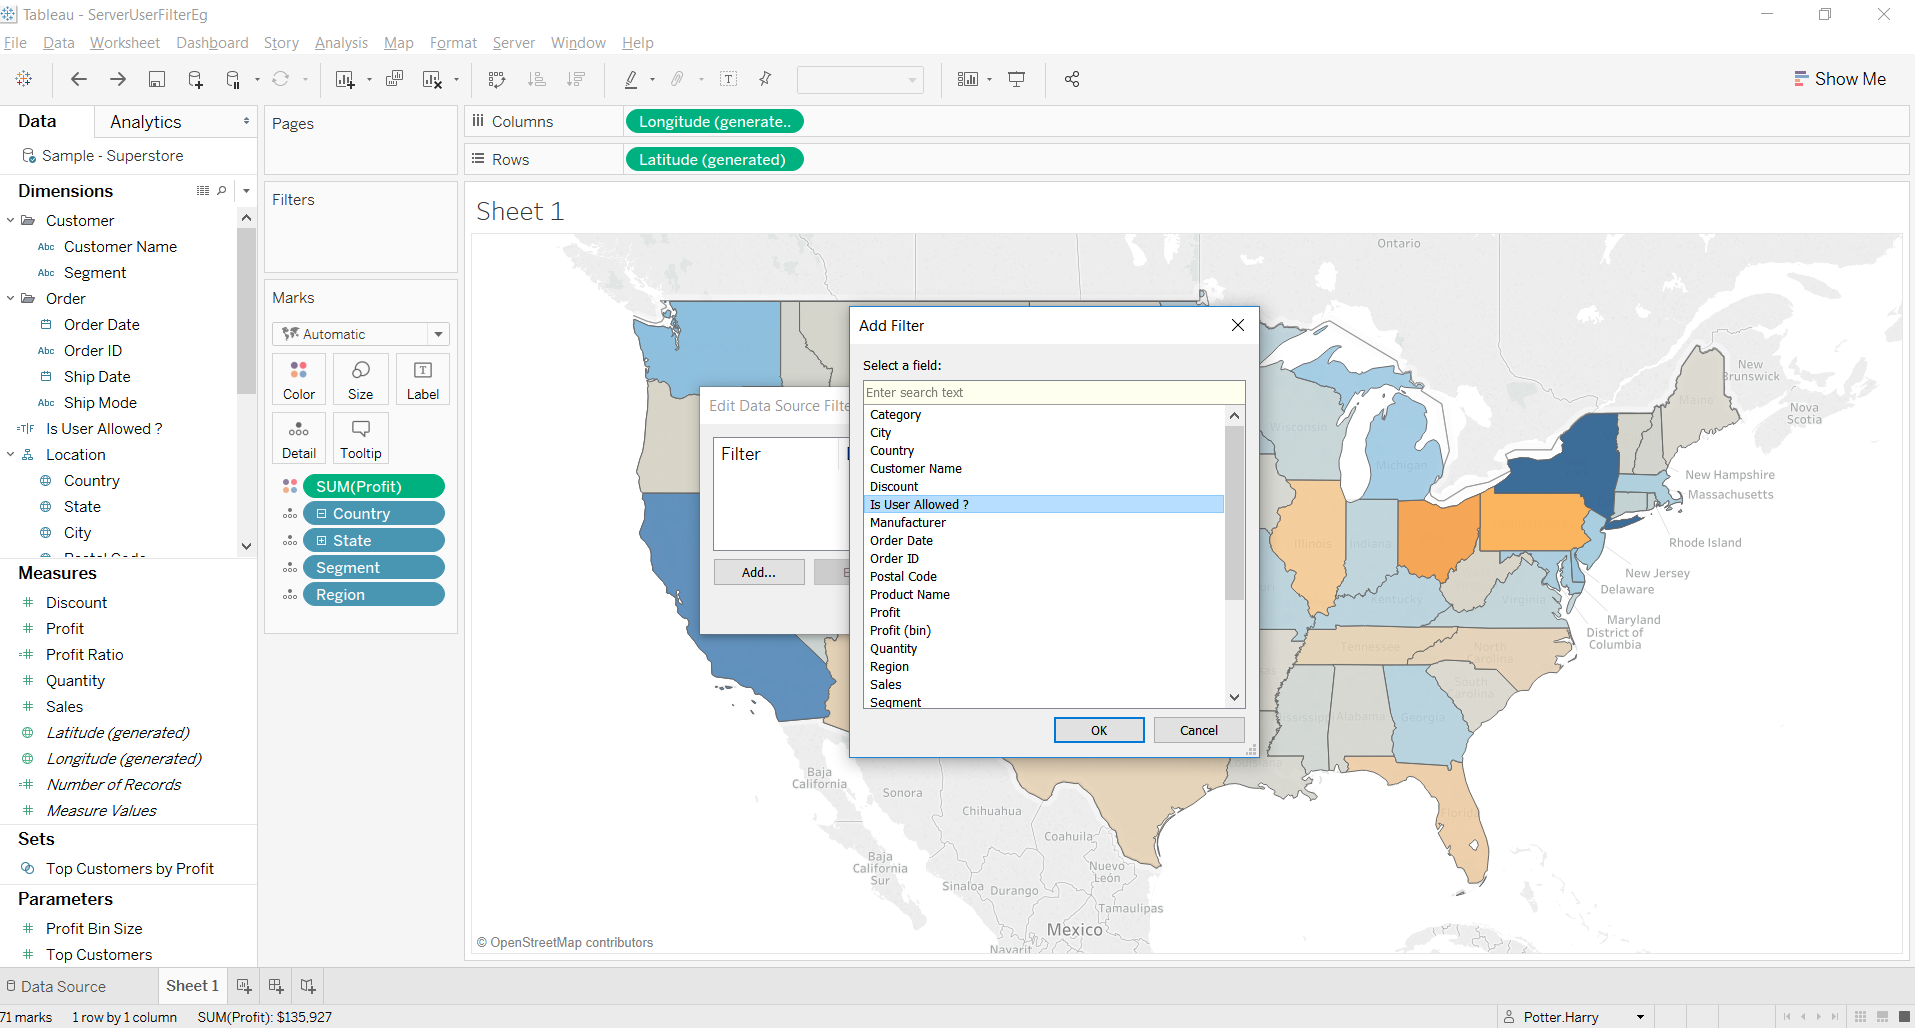
Select add filter, find the user calculation and click ok:
Select true:
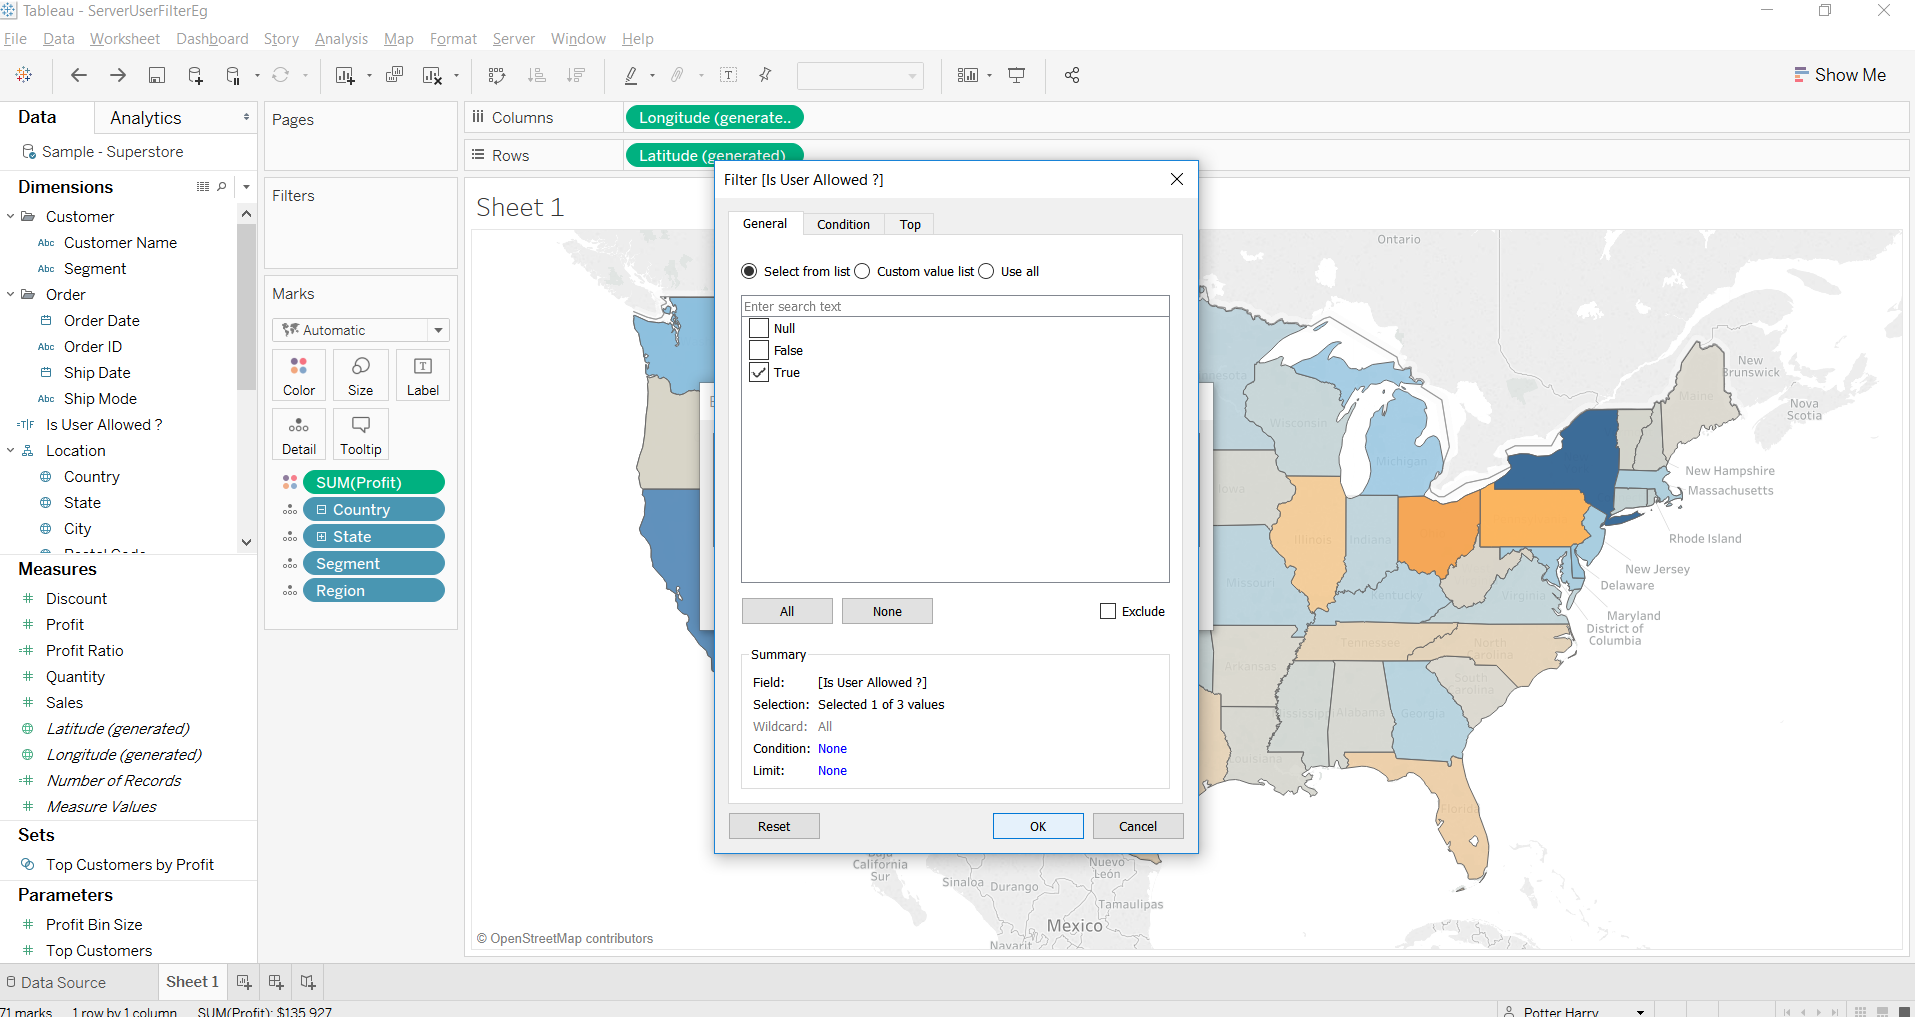
And the filter is applied, now the user can only see the data related to their segment and region.
Notice that this filter was applied directly to the data source instead of simply dragging the calculated field to the filters marks card. Although both methods produce the same effect, applying to the data source is more secure.
Once the workbook is published to server, should the user have editing rights and the calculated field is added to the filters marks card the user could remove the filter exposing the entire data. In the example below the filters marks card is right-clicked displaying the option to remove for a user that can edit:
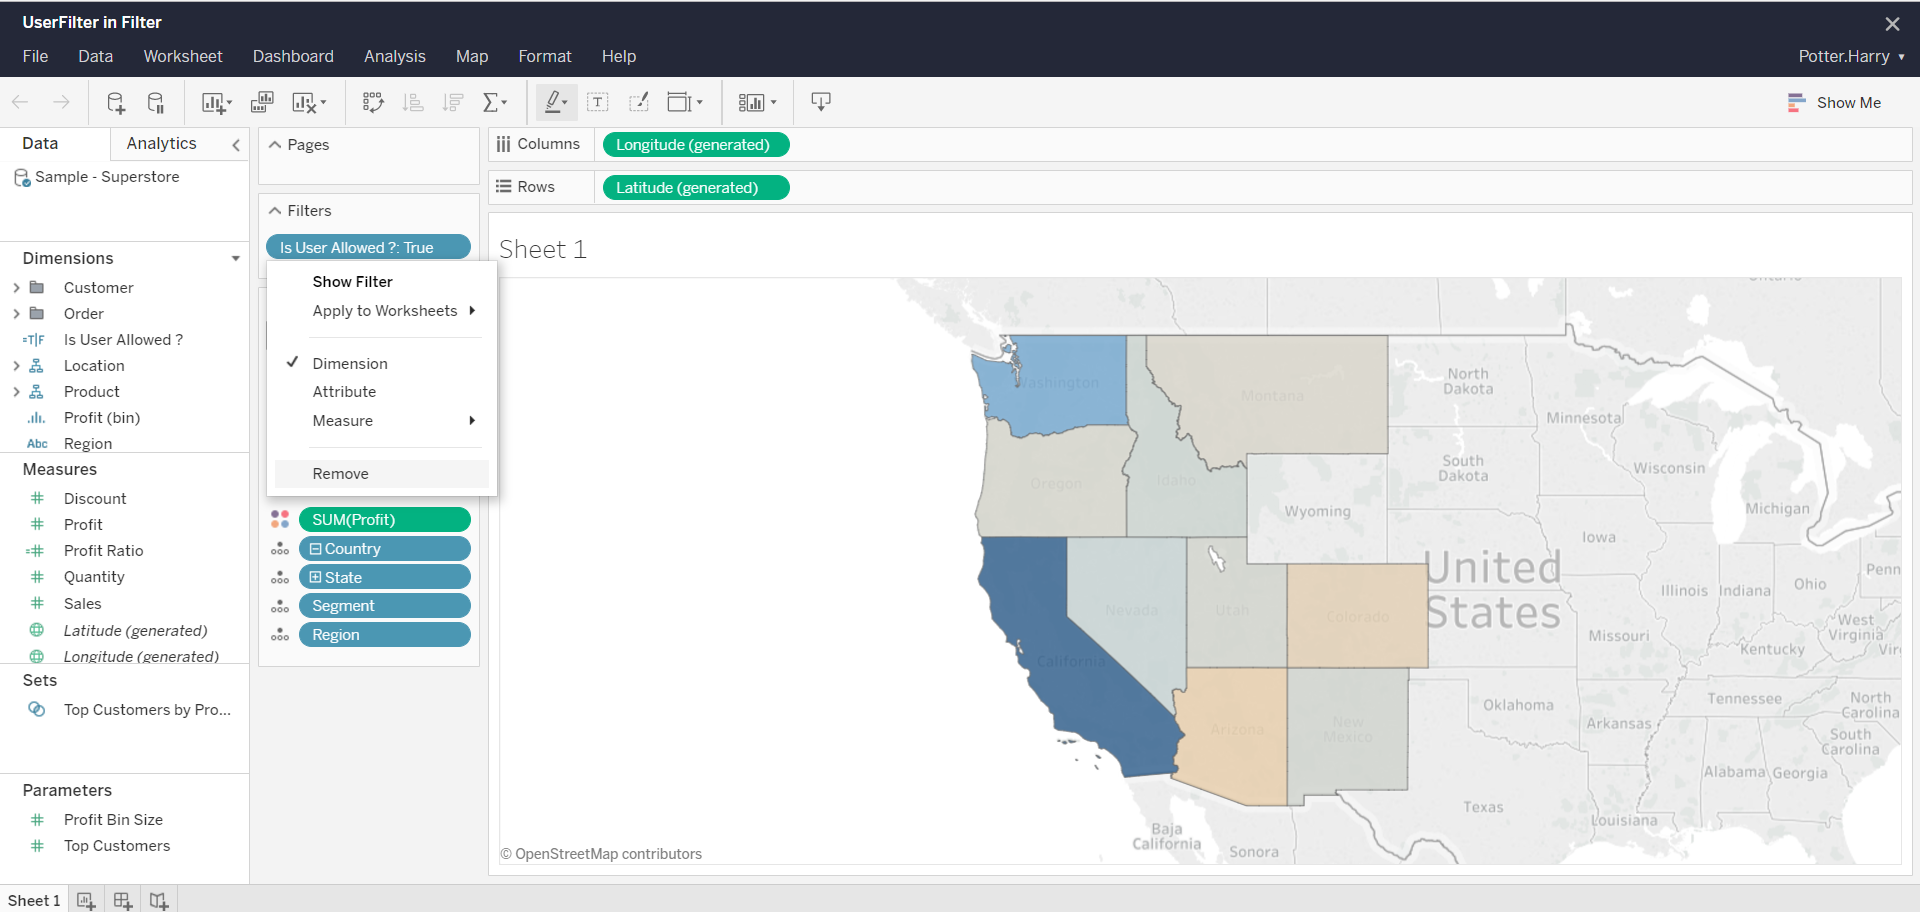
However, if applied to the data source such an option does not exist to the user when editing on server. This method is applied in the example below; the data source has been right-clicked and no option to edit filter is available.