


In the previous part, I shared what is an Analytics app in Alteryx and some Interface tools to build an app in Alteryx. In this blog, I am going to use some Interface tools to build a simple app in Alteryx.
One rule when you build an Analytics App is you must build a workflow and run it first. If the workflow can run successfully, then you can add Interface tools to build an Analytics app. I will walk through step-by-step how to build an analytics app including:
1) Explore the dataset
2) Sketch the user interface
3) Build a normal workflow
4) Put the interface tools in to build an app
5) Edit the Interface Designer
6) Run and Debug the app
- Before starting, I will download an example dataset to demo. You can download the Sample Superstore Dataset at: https://data.world/ehughes/superstore-sales-2023.
- Show the Interface Designer window by going to View menu > Interface Designer (or holding Ctrl + Alt + D)
1) Explore the dataset
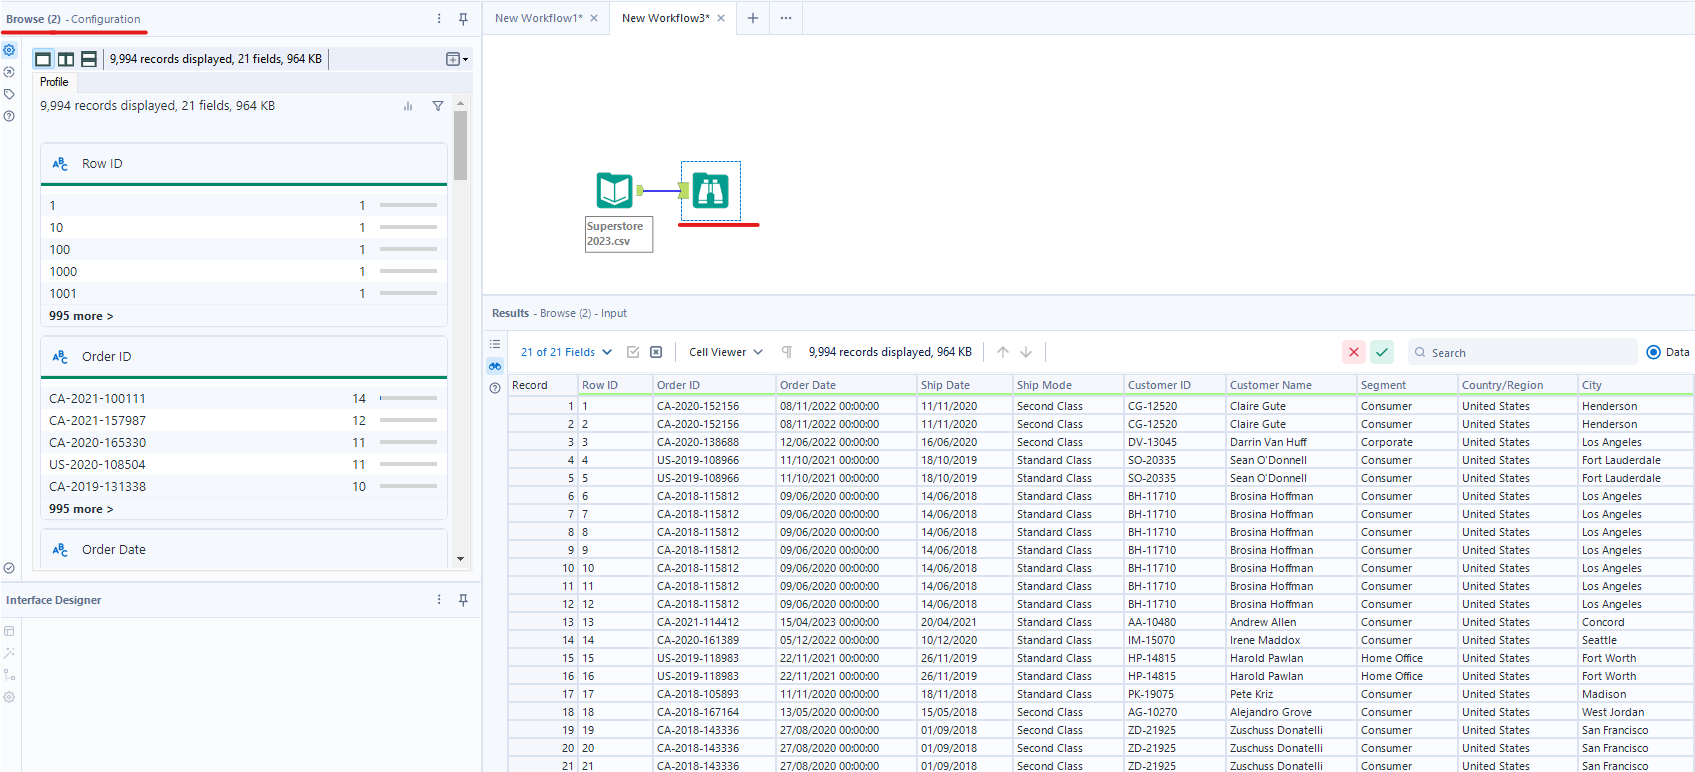
I drag the dataset into the canvas in Alteryx. Then use the Browse tool to explore the data. Then, answer some questions:
- How many total columns, and rows are in the dataset?
- How many metric/ dimension fields?
- Who do you build the app for?
- Why do you need to build an app? (the purpose)
- Which features do you need in the app?
- What do you want to show/ output?
2/ Sketch the user interface
After answering those questions in part 1, you can start sketching the interface on the paper or Excalidraw.
For example, from the Sample SuperStore dataset:
- There are 21 columns (4 metric fields, 2 date time fields, and 15 string fields) and almost 10,000 rows.
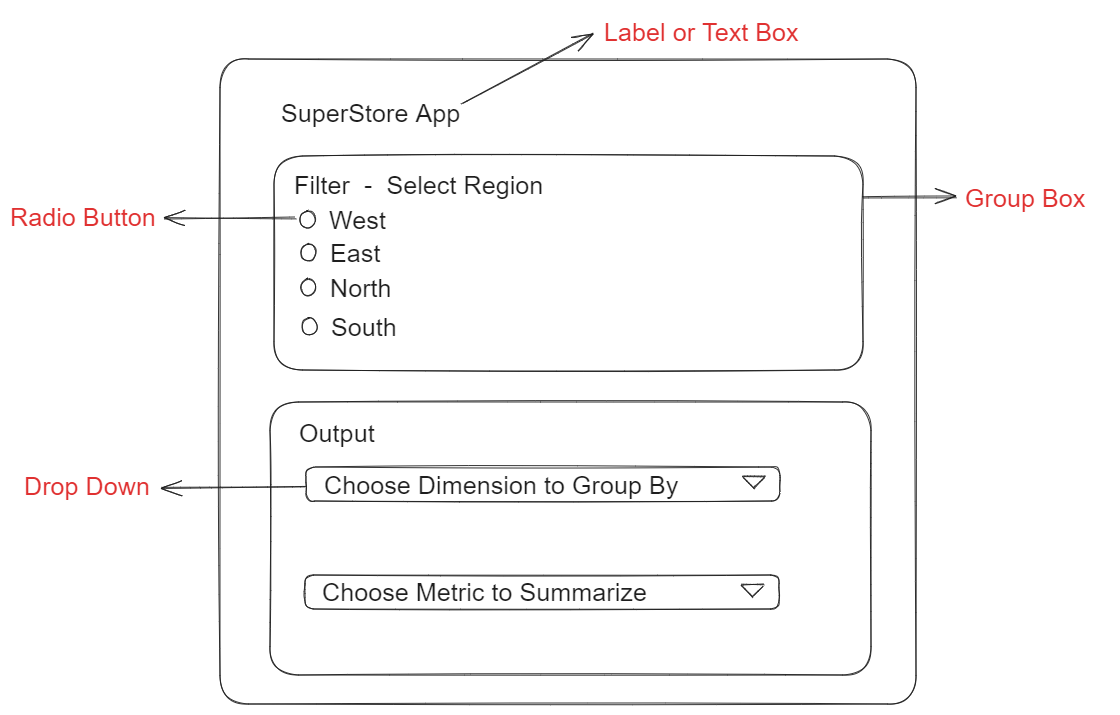
- Who? Executive Manager of a Retail Store
- Why? Summarize the sale/ profit group by dimension fields
- Features? Choose Region, and dimension fields to group by and choose metric field to summarize
- Output? Show the data table with the sum of metric field groups by specified dimension
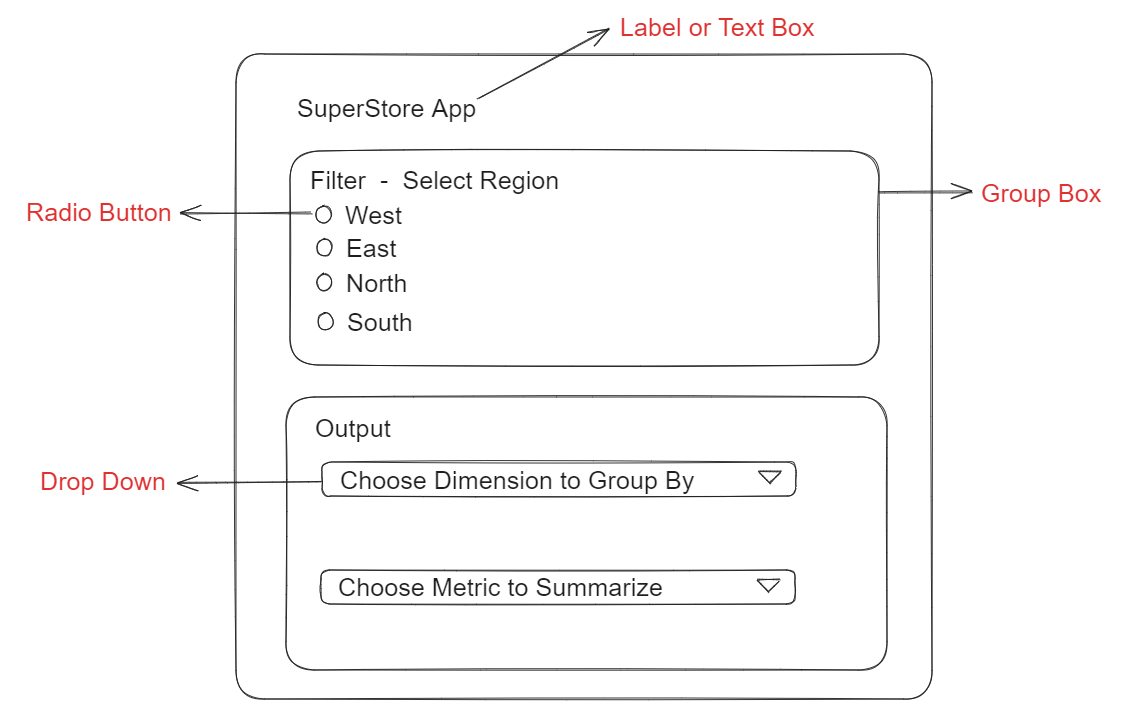
Then, I use the Excalidraw page to sketch the Interface I would like to build in Alteryx. I also note down which Interface tool I need for each feature (Image 2).
3/ Build a normal workflow
According to the Excalidraw sketch, I need to filter the Region field first. Then, choose the Dimension to group by with 1 specified metric field.
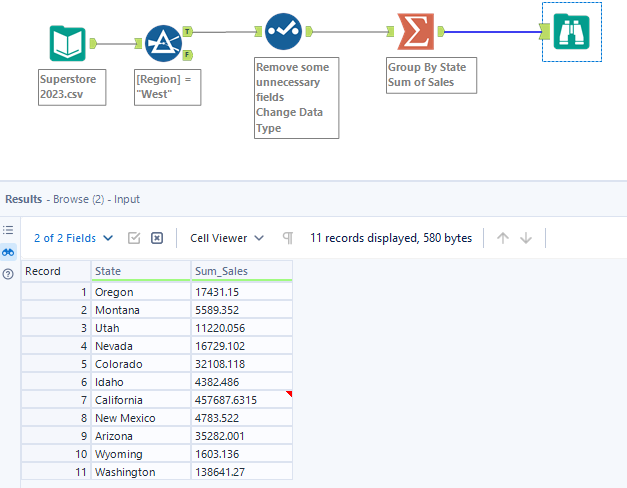
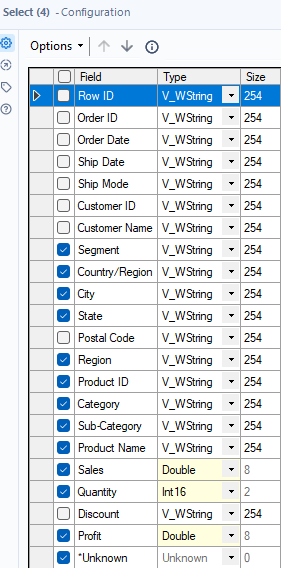
In Alteryx, I use the Filter tool to filter any Regions in the dataset. I used a Select tool to remove some unnecessary fields and change the data type of the metrics field (the original data type is String) (Image 4). After that, I use the Summarize tool to group by any dimension fields (I choose State) and choose a metric field to summarize (I choose the sum of Sales). Then, output the result with the Browse tool (Image 3).
4/ Put the Interface tools in to build an app
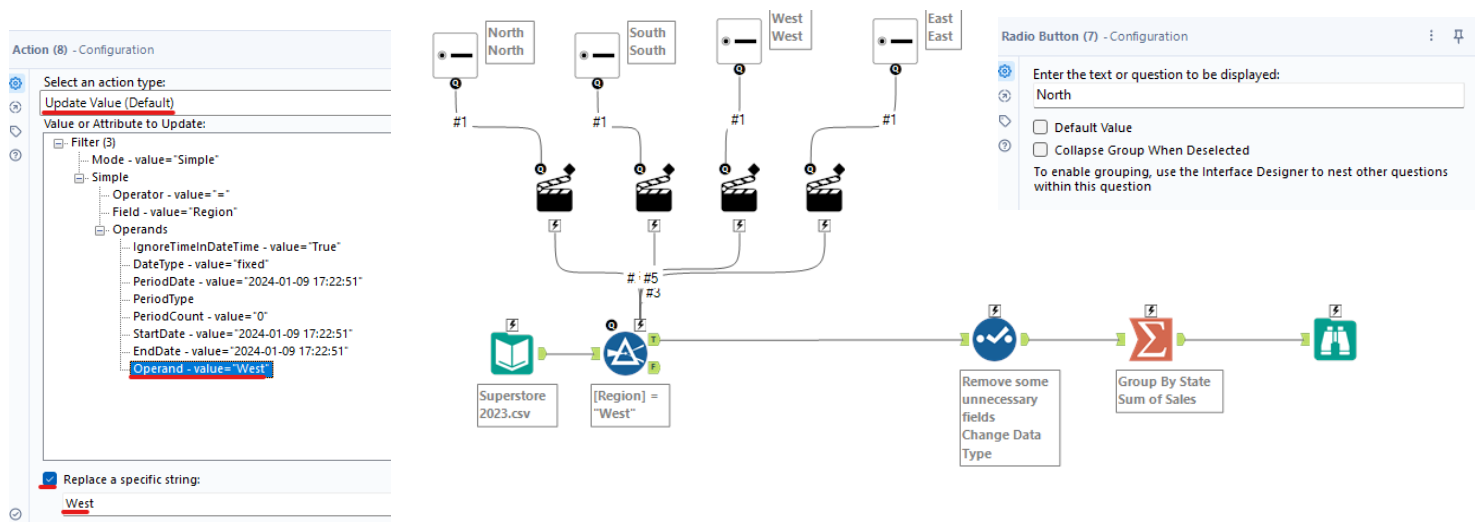
Based on the Excalidraw sketch, I need 4 Radio Button tools for 4 Regions. I drag the Radio button from the Interface palette to connect the Q output anchor with the lightning bolt input anchor of the Filter tool because I want to change the West value (from the Original workflow). (Image 5)
- In the Radio Button's Configuration window, I put each Region value in the text box in the Radio Button tool.
- In the Action tool, I choose Update Value (Default) for the action type. In the value or Attribute to Update part, I choose Operand - value="West". That's the value that I want to update when the user switches to other options.
Remember to check the box Replace a specific string below and put West in the box. It means when the user switches to another option, the action tool will replace the word West with another option (For example: North).
Let's move to the Select tool next. From the previous part, I changed the data type of metric fields and only kept some dimension fields and metric fields. Based on the Excalidraw sketch above, I need to build 2 Drop Down menus. One Drop Down tool is for choosing the dimension field and another Drop Down tool is for choosing the metric field.
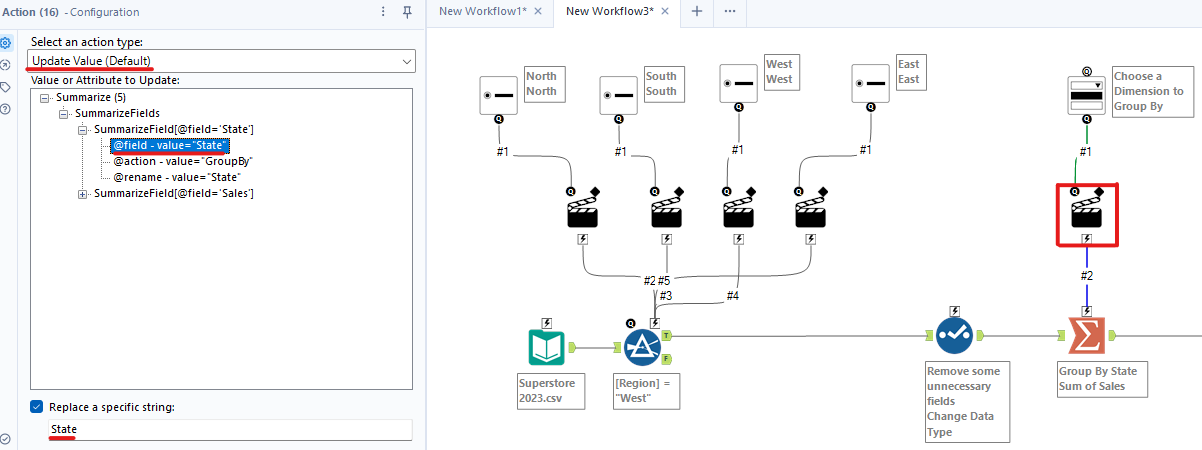
- Update Dimension Field: I drag the drop-down tool to connect the Q output anchor to the lightning bolt input anchor of the Summarize tool because I want to update the dimension field. The Action tool will appear automatically (Image 6).
Then, in the Configuration window of the Action tool, I choose @field - value = "State". Note that, @rename-value = 'State'. The "State" is also assigned to the @rename - value, but Don't choose this because it only renames the field. Then, check the box Replace a specific string, and make sure the State is within that box because we want to replace the State field with other fields.
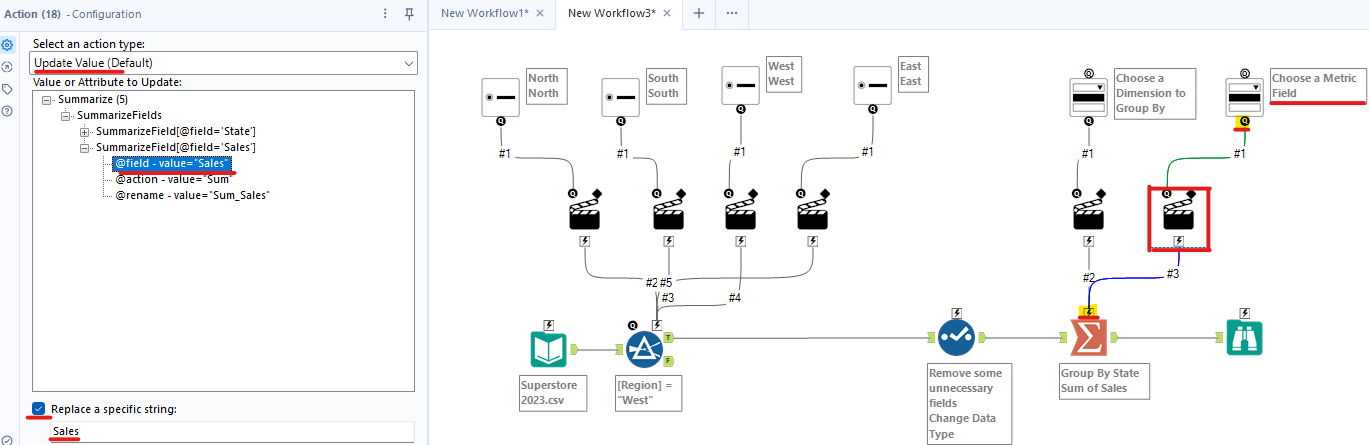
- Update Metric Field: I drag another Drop Down tool to connect the Q output anchor to the lightning bolt input anchor of the same Summarize tool.
In the Configuration window of the Action tool, I expanded the SummarizeField(@field='Sales') and selected @field - value = 'Sales'. Also, check the box Replace a specific string and make sure the word Sales is in the box (Image 7).
- Passing the dimension field name into Drop Down tool: I connect the output anchor from the Select tool to the Q input anchor of the Drop Down tool for the dimension field.
In the Configuration window, Alteryx automatically understands the list values from the Connected tool (Select tool). In the Properties part, I choose V_WString. It means that only shows fields that have V_WString.
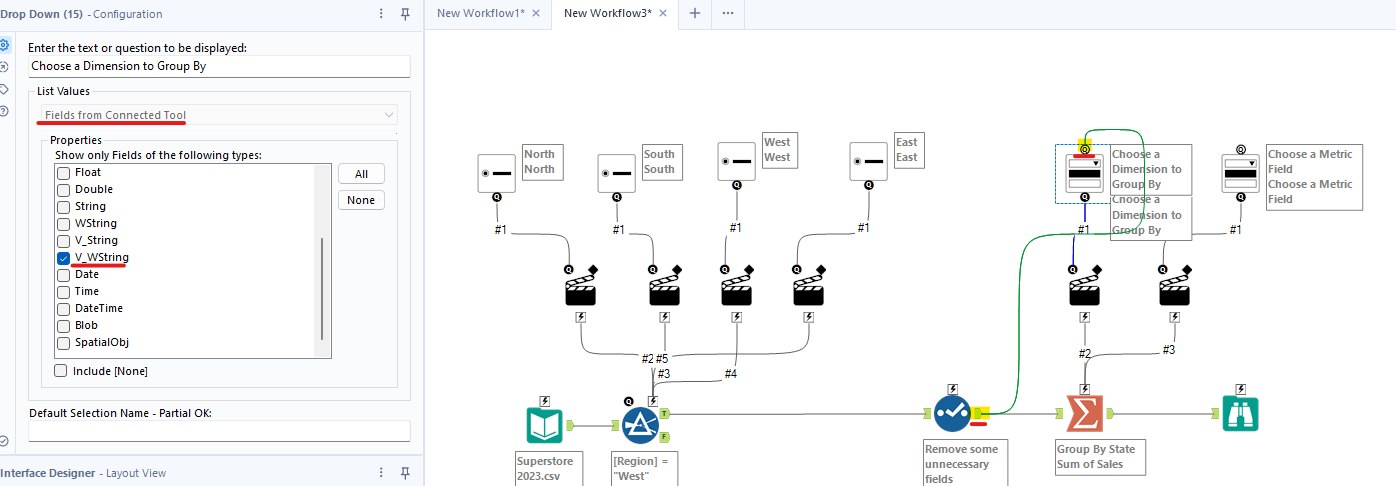
- Passing the metric field name into the Drop Down tool: I also do the same as I did above. I connected the output from the Select tool to the Q input anchor in the Drop Down tool for the Metric field. However, at this time, in the Properties section, I choose Double and Int16. Those data types are for the Sales, Profit, and Quantity fields.
Those are the steps to build the app. But we need to configure the setting in the Interface Designer.
5) Edit the Interface Designer
After completing the workflow with the Interface tools. I need to edit the design for the app and the output.
- Edit the App's design
I open the Interface Designer window (View/ Interface Designer). The original design is the same as Image 9.
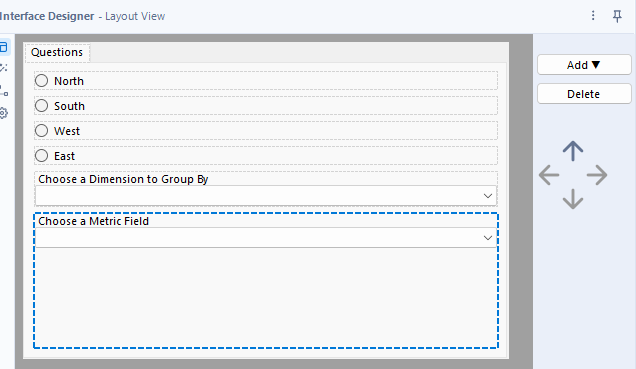
and we want like this:
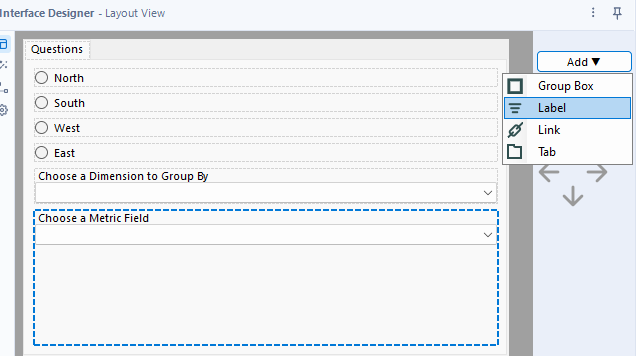
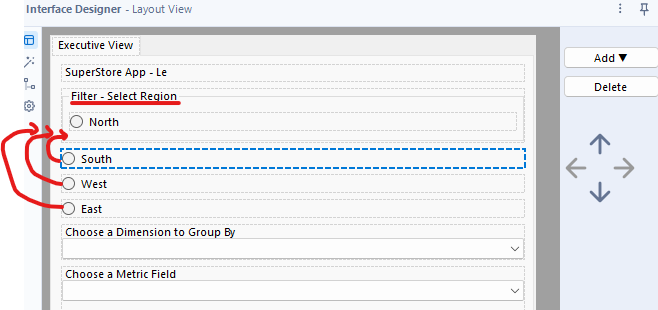
From the Layout view, I click on the Add button and choose Label to set the label for the app (Image 10).
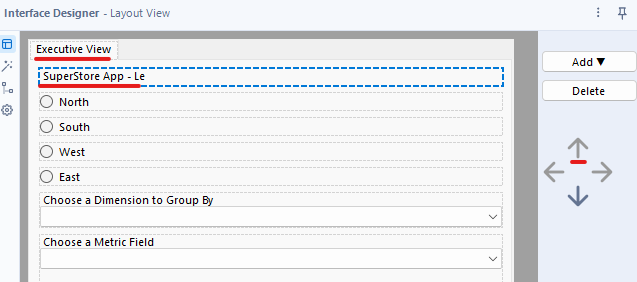
I use the Up arrow on the right panel to move the Label to the top. I also rename the tab to Executive View (Image 11).
From the Excalidraw sketch, I want to group all the regions into 1 Group called Filter-Select Region. Another group called Output contains 2 Drop Down menus. I move the Group box to the top; then I move all elements into that Group Box by using the Up arrow. Make sure the elements are in the Group Box by looking at the indentation.
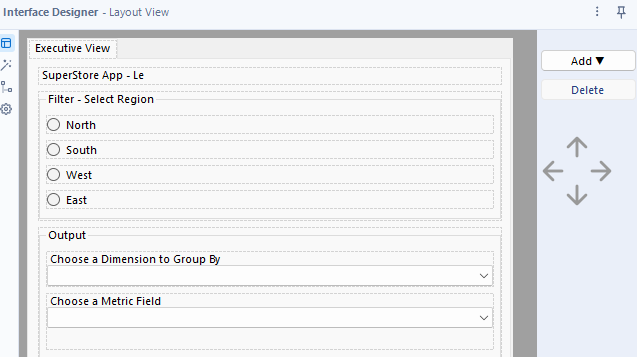
I do the same for another Group Box including 2 Drop Down tools. You will get the Interface looks like Image 13.
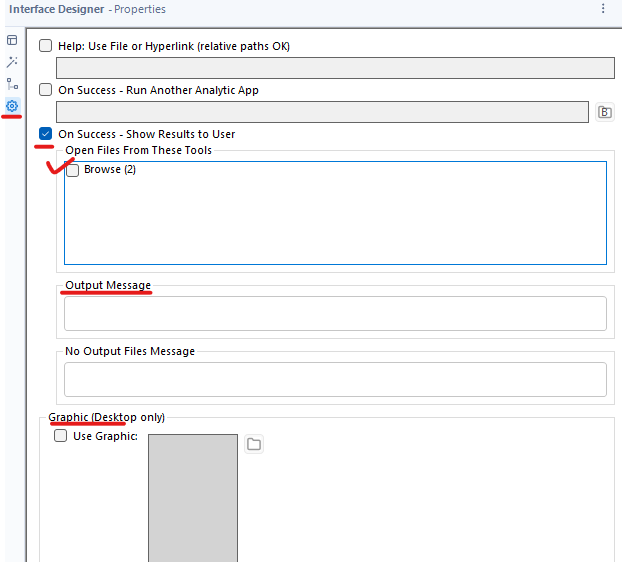
Finally, go to the Properties view on the left, in the On Success part, I check the Browse tool. That is the output that I want to show when the user clicks on the Finish button to run the app (Image 14).
6/ Run and Debug the app
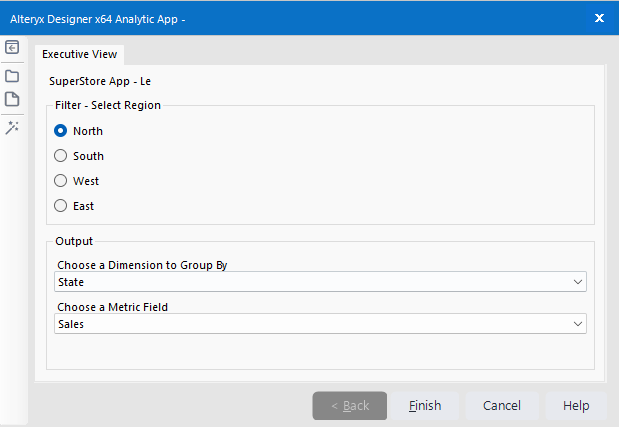
In the final step, you can go to the Workflow menu in the Configuration window to check that the current workflow is an Analytics App. Then, run the workflow (Ctrl + R). After that, run the workflow as an App to test the app. It will open a window the same as in Image 15.
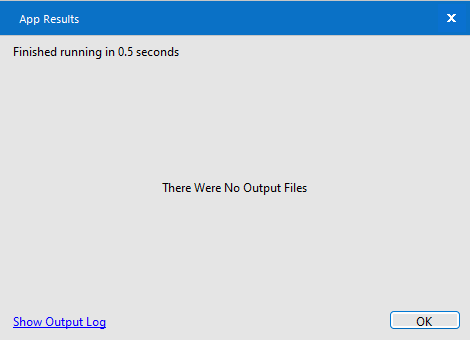
After I click on Finish, the result returns nothing (Image 16).
So now, let's debug the app with me :) Let's open the Test View and click on the Open Debug button (Image 17).

A new Debug Workflow will be opened. Then, click on the Filter tool. In the Configuration window, it shows Region = 'False'. Oh oh!!! It should return to the Region. Why does it replace the West region with a Boolean value "False"? (Image 18)
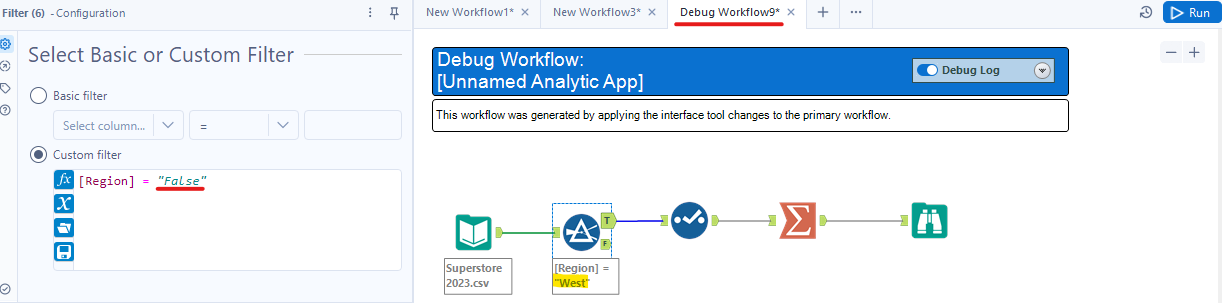
If you take a look at my first blog here, the result from the Radio button tool is True or False. So how can we fix this problem?
Let's go back to the original workflow.
1/ There are many Action tools; instead, I can combine all Action tools into 1 Action tool. I did that because every time you click on the Radio button, it will update the value. You repeat it with other Action tools, so we can combine it into 1 by connecting all Radio buttons to 1 Action tool.
2/ In the Configuration window of the Action tool, I change the action type to Update Value with Formula (Default). I click on the Operand - Value = "West". That is the value that I would like to change. But now, I need a formula to change it. In the Formula box, I click on the ... button and type:
IF [#1] THEN 'Central'
ELSEIF [#2] THEN 'South'
ELSEIF [#3] THEN 'West'
ELSEIF [#4] THEN 'East'
ELSE ''
ENDIF
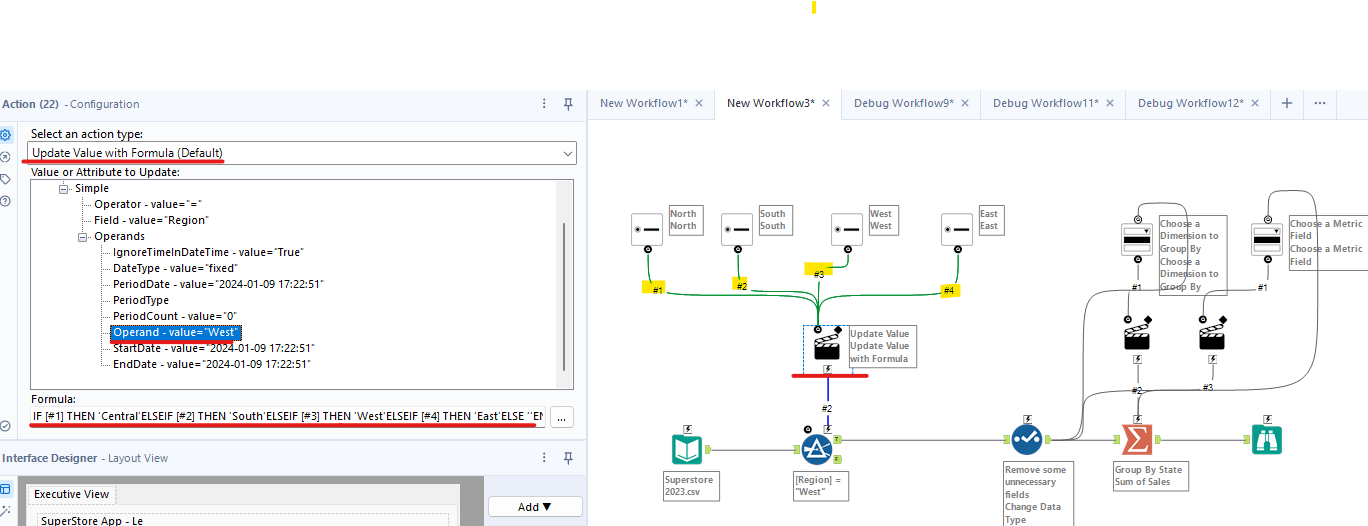
It means when the user chooses South (flow #2), Alteryx will check the condition. For example: Flow #2 is selected, then returns 'South'. It will replace the current value 'West' with 'South'. That's how it works.
3/ Check the data
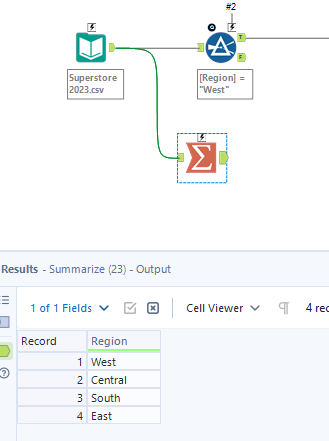
I use the Summarize tool to group by Region in the dataset. The result returns West, Central, South, and East. However, my Radio button shows "North" which is not in the dataset. I also need to check the condition in the Action tool to make sure I used the correct values.
Now, I run the workflow and run the Analytics App again to test (Image 21).
Finally, you can save the app under the .yxmc file extension. Congratulations!!! You just built an Analytics App in Alteryx.
In this blog, I shared how to build an Analytics App in Alteryx step-by-step. There are 6 steps total to build an app. Understanding the Interface tools, how the tool works, and what values each Interface tool returns are important. It would be very helpful when you get errors and need to debug. This blog is long, so I end up here. In the next blog of the Analytics App in Alteryx series, I will share how to build a Chained App in Alteryx.
I hope you enjoy this blog and hope to see you soon in my latest blog!