As part of the Data School training, last week each member of the cohort had to teach a topic to the rest of the team. The topic I was assigned to is Spatial Analytics in Alteryx and Tableau.
Spatial Analytics is used here for the study of geographical data, in order to provide an additional insights in terms of visualisation. Spatial analytics includes the distribution of data in a geographical map and the visualisation of spatial patterns of the data.
Businesses and organisations use spatial analytics for many different reasons that can be read in more details in this Forbes article:
- Geo-coding adds data insights
- Visualise the data and the use of spatial for weather forecasts, news, delivery companies
- Visual decision making to spot issues or opportunities (where customers live, where to build the next shop)
- Marketing uses of location with mobile phones and social media Geo targeting
- In Madagascar mapping data is used to improve footpath routes for emergency food distribution
- Location mapping is used to improve transportation routes to reduce cost and decrease pollution
After a broad discussion of the different uses of spatial data for business intelligence, we spoke about the two main spatial object: polygon and poly-line.
- Polygon is a simple bounded region
- Poly-line contains multiple line segments where a line has a start and an end point but can have any number of points in between
Spatial analytics in Tableau Software is great, because it enables the map visualisation of data with only the existence of Latitude and Longitude and other spatial objects such as countries or states. It is possible to recognise fields with a geographical role by the world icon in Tableau.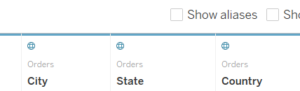
One of the new features in the latest version of Tableau 2018.1 is about Spatial improvements. In addition to the Polygon mark type, already present in the previous versions, which will be looked at later in the post, there is the introduction of the dual axis mapping. It is now possible to duplicate the Latitude field in order to add a second mark type in the view.
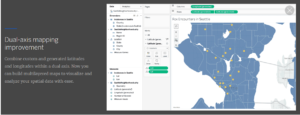
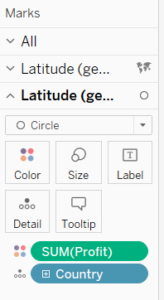
It is very simple to use: simply double click on a geographical role and add Latitude one more time, in order to create a dual axis. By going on the mark type it is possible to edit the second Latitude to add a different view.
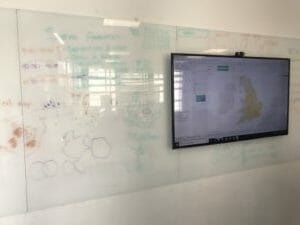
As part of the teaching session, each member of the Data School draw two Alteryx spatial tools on the board and we went through the definition together.
Buffer tool will take any polygon or poly line spatial object and expand or contract its extents by the user value. It could be then a smaller or bigger section compared to the original one.
Create points tool creates a point-type spatial object and it is always used as a preparation before using other spatial tools in Alteryx.
Distance tool calculates the ellipsoidal direct point-to-point and can be in miles, kilometres or drive-time (minutes).
Find nearest tool shortest distance between spatial objects in two different files.
Generalise tool decreases the number of nodes that make up a polygon or poly line. Simpler version of the original map, might be with a more geometrical shape.
Heat Map tool individual records are analysed and generates polygons representing different levels of heat in a given area. This tool will be used below and export it in Tableau for visualise the data.
Make grid tool takes a spatial object (point or polygon) and creates a grid. Clip to polygon in alteryx.
Poly-build tool takes a group of spatial objects and draws a polygon or polyline.
Poly-split tool splits polygon or polyline objects into their component objects. It is used for spatial layer developments.
Smooth tool uses a B-spline smoothing algorithm to round off the sharp angles of polygon or polyline objects by adding nodes along the lines that make up the object.
Spatial Info tool extracts tabular info about the spatial object (area, centroid, latitude, longitude).
Spatial Match tool establishes the spatial relationship (contains, intersects, touches) between two spatial objects, where at least one should be a polygon.
Spatial Process tool combines multiple objects or cut the spatial objects of the input table. Create and edit spatial objects with this tool.
Trade Area tool creates regions around point objects. Created by defining a radius around a point or by a drivetime.
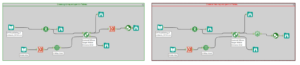
Some of the Alteryx spatial tools drawn on the board with the result of the grid map developed in Alteryx and built it in Tableau during the class.
Ben Davis blogs and advice have inspired me when preparing the teaching material for Spatial Analytics in Alteryx and Tableau. I have decided to use the Department for Transport data set for UK car accidents to build a heat map and a grid map.
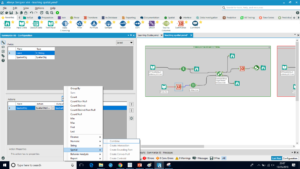
In Alteryx it is necessary to have also a shape file .shp of the UK to join with the main data set. Follow the step-by-step Alteryx flow to build a grid map and a heat map.
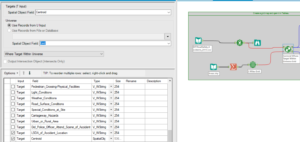
The first thing to do for both Heat map and Grid map is to use the Create Points tool from the main file and to use a Summarise tool from the shape file, selecting ‘Spatial object combine’. After the summarise tool, insert make grid tool and select 2 miles for instance, to create a grid line of this measurement.
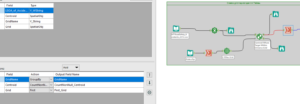
Combine the two files together with the Spatial match tool where the Target is the main file and the Universe the shape file with the spatial object field centroid and grid. Select then the fields in the list with at least two targets and two universe selections. This tool is used for both the heat map and the gridmap. From this point the two flows will differ.
To create a grid map from this point, insert another summarise tool, to group by Grid names and count the centroids closer to the first grid, as shown in the flow below. After this point the Alteryx flow is finished and it is possible to export it to Tableau with a Macro built by Craig Bloodworth .
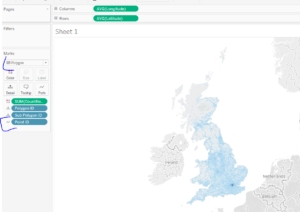
When in Tableau it will be really easy to create the grid map by using the Latitude and Longitude, the polygon mark type, the colour and the path marks, Just few clicks away!
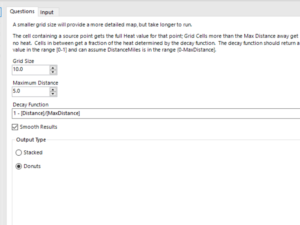
To create the Heatmap instead, it is enough to add the heatmap tool in alteryx straight after the spatial match tool and configure it before adding the polygon converter Macro. Select the centroid as input configuration in the tool with a grid size of 10 and a maximum distance of 5, with smoothing results ticked box.
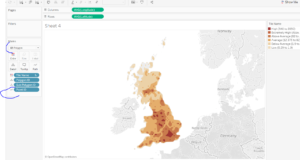
After the Macro conversion it is possible with few clicks to create a Heatmap in Tableau, in a very similar way to what we did for the grid map described above.
Hope this was helpful for everyone!