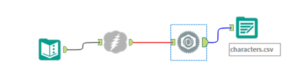
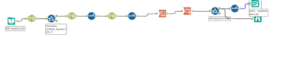
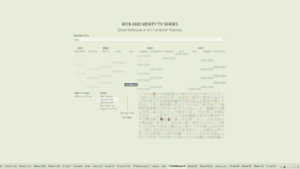
The topic for today’s Tableau dashboard is the famous American TV series Rick and Monti with all the 30 episodes, 436 characters from 7 species and living in 53 locations. Today’s challenge started from parsing out the data set with JSON parse, in Alteryx, from Ricky and Monti API. Challenge accepted and quite straightforward to work on.
I decided to create an exploratory Dashboard for those like me, who have never heard about the series before and would like to know more about the characters, locations and episodes names together with each episodes’ release name and of course the image of the characters.
The visualisation is also available on Tableau Public.
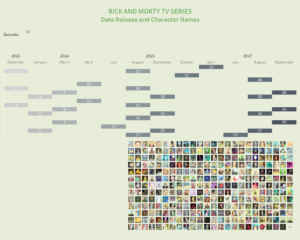
For the release dates I have used a calendar format with months and years in columns and with days on rows, the episode number into text and the episode title in the tooltip.
For the characters faces I used the same worksheet twice, first for the overall view and then for the viz in tooltip to zoom in the character face.
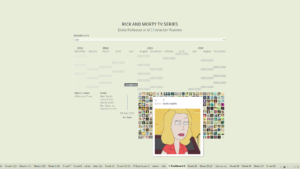
At the same time, I wanted to provide more information for those looking for the characters names but also locations, episodes name that are then linked to the characters’ names. Probably the fans of the TV series already know all of this by heart and just want to refresh their knowledge through the viz. On the other hand, those who have never heard about Rick and Monti can learn a lot about it but exploring the Tableau visualisation.
In order not to overcrowd the view with too many details, I created a quick trick to show more information by hiding some of them when no interactions is made.
How to hide sheet and trigger the view through a Dashboard action
I have hidden two worksheets, which are shown when clicking on the Source sheet, which will also filter both of them accordingly.
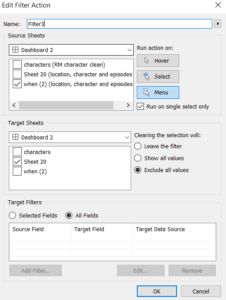
Source sheet: the sheet where the action is directly perceived. I used the calendar with the episode release as a source sheet. Select run action on Menu and run on single select only. The target sheet is the one that has to be hidden when no action is detected, tick only the desired one and clering the selection will: exclude all values.
Remember also to hide the sheets names to stay 100% in incognito in your dashboard!
Through dashboard actions it is in fact possible to hide worksheets from the view. The worksheets appears when the action is triggered by the click on the target sheet. In this case, by clicking on an episode release date from the Calendar, the respective information on Location and characters are displayed.
The other dashboard action is set by the highlight when hovering over a character name, which triggers the highlight action on the shapes with the characters faces. It is then really interesting to see all the different faces and images of just one character within the individual episode selected.
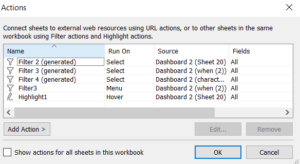
All the dashboard actions used in the view to make the visualisation slimmer and quicker to process. Notice that when you use the menu, exclude all values to hide a worksheet, you will need also to rename your filter, since its name will be shown in the tooltip of the source sheet. I rename it as click for more info, to trigger the interactivity of the user.