Design Success – Week 6 of Data School
Some people are born with an eye for design, and it all comes very naturally to them. I, however, am not one of those people. My professional background involved a lot of number crunching in Excel where the focus was on function rather than form. So I am always super excited when we have guest speakers come in to do design workshops. This week information designer Rhiannon Fox came in a took us through her design process.
Before Data School, my typical Tableau workflow was to get a data set, explore it in Tableau throwing various fields in the view until I found something interesting, then try to add some polish to make the chart look nice. I was producing bog-standard stuff and was totally in awe of well-designed charts (like the one below) making the rounds on social media.

What’s the secret to creating something beautiful AND informative?
Six weeks of Data School and the design workshops with Rhiannon Fox and Caroline Beavon taught me that all successful infographics have one key thing common: A PLAN!
These amazing graphics don’t happen by accident; there is always some design process in place. The key is to find a method that works for you. Caroline taught us her process back in week three, this week we saw how Riannon does it. There is no one size fits all solution. At the moment, I am combining bits from both to try and take my visualisations to the next level.
My Process
- I take a quick look at the data to see what the fields are and get a feel for the type of information available.
- I brainstorm about the topic, do some googling, and put together a list of keywords and create a Pinterest board centred around those words for inspiration. This is about thinking of all the stories I could potentially find in the data.
- Move to quick sketches, not introducing colour at this point, but simply getting all my ideas, good and bad out of my head and onto paper. Still thinking about several potential stories at this point.
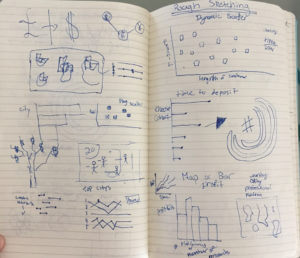
- Pick a concept that works and do a more detailed sketch, on A3 paper if possible.
- Look at my Pinterest board again, to make sure I’m still on topic.
- Last but not least, move into Tableau and bring my vision to life.
Full disclosure, the first time I was taken through some these steps I was a bit frustrated and confused, I didn’t fully understand how writing a list of 100 words was going to help me create anything, yet alone something beautiful. But it works! It really helps me focus on one idea, so when I do dive back into the data I am only trying to tell one story in Tableau. I have replaced hours of faffing about in the data with planning, and am very pleased with the results. When I look at creations on my Tableau Public profile from before DS to today I am amazed at how far I have come in just six weeks.
If you struggle with design like I did, give some of these methods a try on your next project. Try to find a method that works for you, and once you do, stick with it!