Data School Week 13 – Teaching Week
I have fallen behind with my blogging once again! Here is a recap of week 13, it was student teaching week for the DS. To help get us comfortable teaching/training others on Tableau and Alteryx, we were each assigned a topic to teach the class. My topic was Dashboard Design. I delivered my 2.5-hour training session the previous week, so I could just relax and enjoy watching the others teach!
Monday
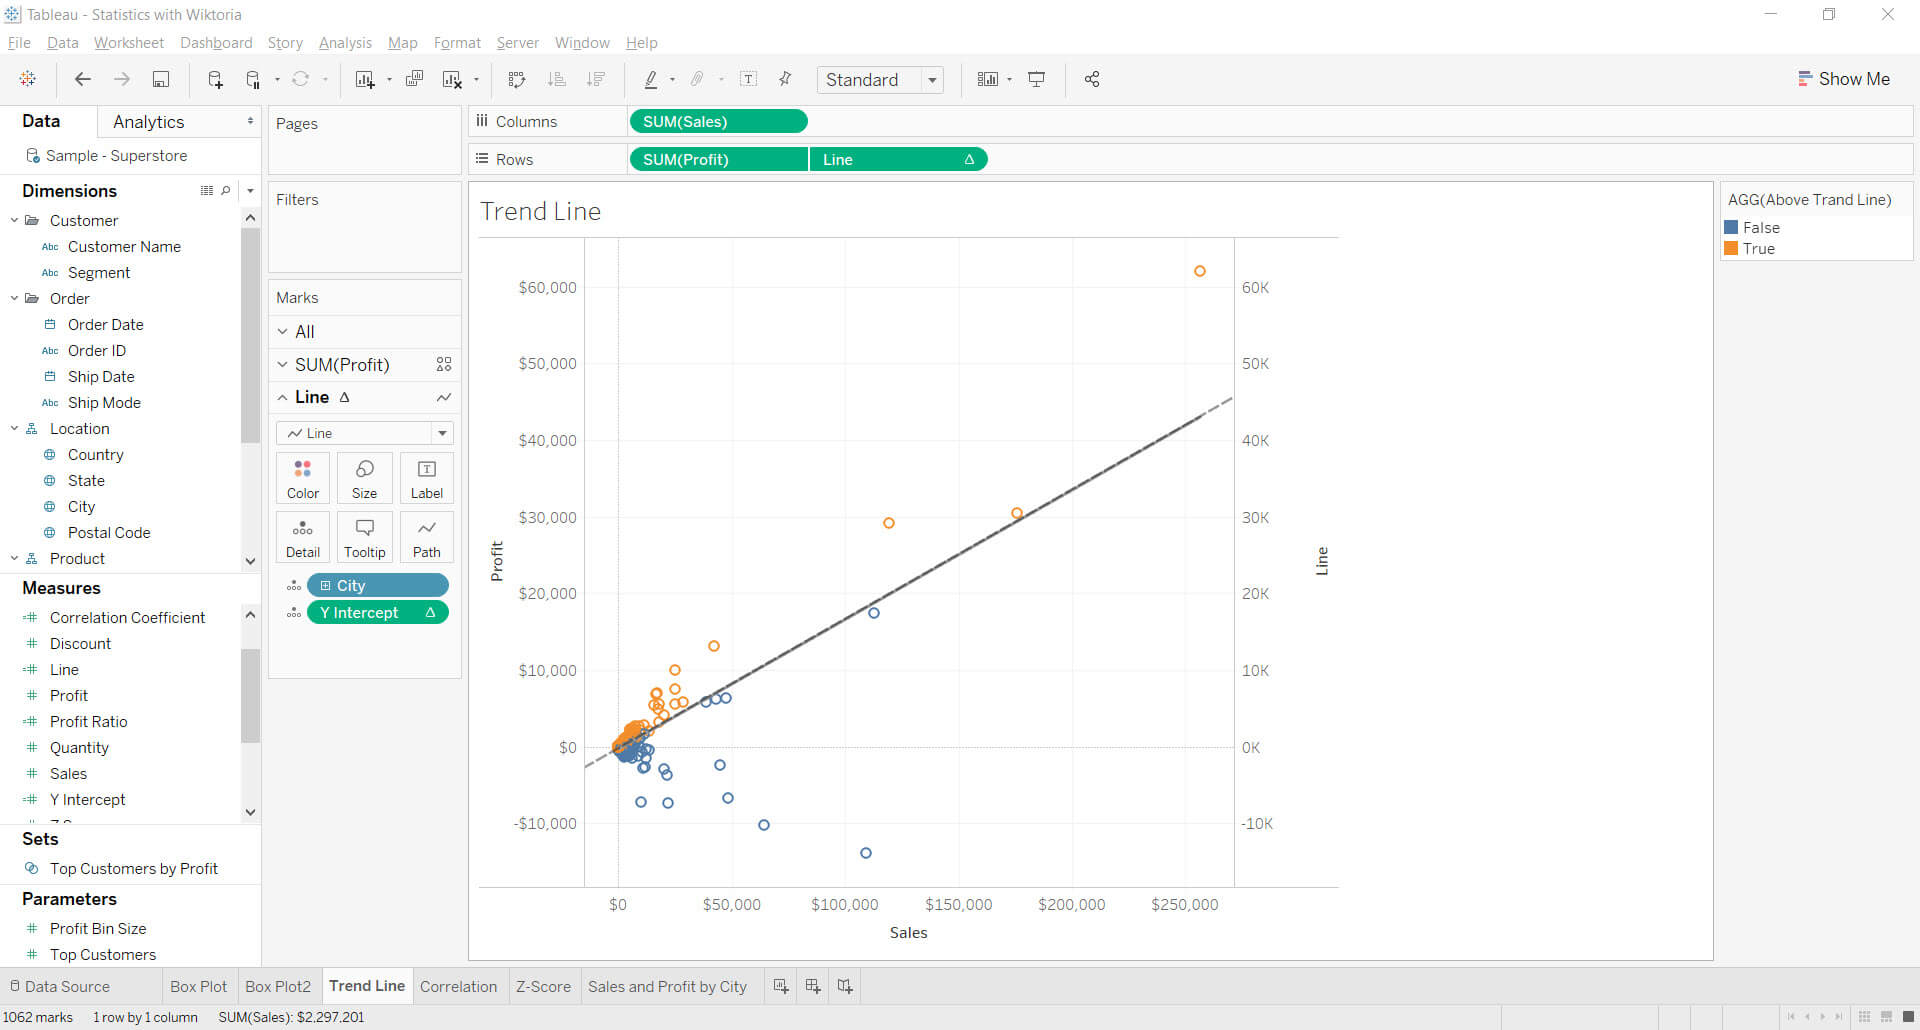
Wiktoria presented her class on Statistics in the morning. I really enjoyed her class. She did a brilliant job of covering statistics 101 as well as statistics in Tableau. My favourite part was learning what Tableau is doing behind the scenes when you drag a Trend Line into the view. For example, if we are looking at Sales and Profit by City for Superstore, we can add a linear trendline and Tableau draws a line with the following formula: ([B (slope)]*SUM([Sales])+[Y Intercept]) where
- Y Intercept= (WINDOW_SUM(SUM([Profit]))*WINDOW_SUM(SUM([Sales])^2) WINDOW_SUM(SUM([Sales]))*WINDOW_SUM(SUM([Sales])*SUM([Profit]))) /(SIZE()*WINDOW_SUM(SUM([Sales])^2) WINDOW_SUM(SUM([Sales]))^2)
- B slope = (SIZE()*WINDOW_SUM(SUM([Sales])*SUM([Profit])) WINDOW_SUM(SUM([Sales]))*WINDOW_SUM(SUM([Profit]))) /(SIZE()*WINDOW_SUM(SUM([Sales])^2)-WINDOW_SUM(SUM([Sales]))^2)
You can then use the following formula to show which data points are above or below the trendline. Above Trend Line = SUM([Profit]) > ([B (slope)]*SUM([Sales])+[Y Intercept])
In the afternoon Neil taught us about Data Scaffolding, which is a technique to pad out or create a data structure for a viz. This includes joining and blending data, pivoting or transforming it, and artificially padding out the original data. A lot of the new features of Tableau 10.2, such as the ability to do cross database joins make many data scaffolding techniques obsolete. The coolest thing Neil showed us was Joe Mako’s What if Analysis, where he creates an entire data viz from only two data points. Data Magic.
Tuesday
Marc and Rachel taught a full day class on Data Connections in Tableau. Marc leads the morning section. He prepared several exercises for us to practice join fundamentals, multi-table joins, blending and unions in Tableau. He also explained the principle of cardinality in a database. Cardinality in a database refers to the uniqueness of values in a column, for example, you can have joins that are one to one, one to many, or many to many. In the afternoon Rachel took us through different types of joins, and what is and is not possible in the latest version of Tableau.
Wednesday
Philip and Jamie taught us Alteryx 101. In the morning Jamie walked us through many of the Alteryx beginner level self-paced training exercises. I didn’t envy him. Teaching a beginning lesson to a room full of experienced users is never easy. In the afternoon Philip took us through a class on Regex and how the Regex Parse tool works in Alteryx.
Thursday
The wonderful Jonathan MacDonald was back to give us another overview of Tableau Server. There is so much I want to learn about server and permissions, but there is only so much you can do with classroom hypotheticals. The day ended with a mock Tableau Server QA quiz; it was tough. I only managed 12/17. Hopefully, I will have a chance to learn and work more with Tableau Server out on placement.
That’s the end of week 13, only 2 weeks left!