Dashboard Week Day 2
During Dashboard week we do a project every day, (usually we do one per week), and write a blog for each project.
International Migrants
Today’s project had the following requirements:
- Get International migrant data by age, sex and origins from the UN website.
- Combine Table 13 through Table 18 using Alteryx
- Create a Tableau dashboard
Excel
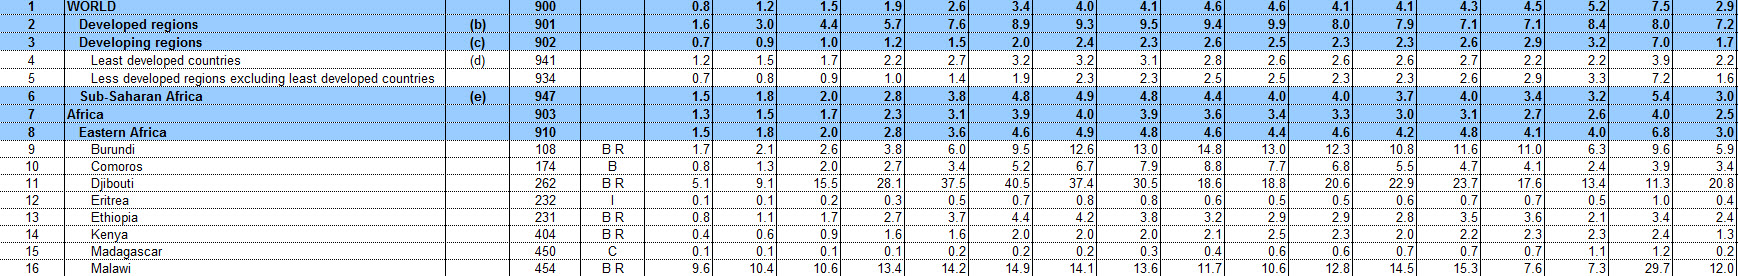
Tables 13 through 18 are tabs in an Excel file. They look at the international migrant stock as a percentage of the total population by age and sex and by major area, region, country or area for 1990, 1995, 2000, 2005, and 2015. There is a table for each year in the data set, so Table 13 is 1990, Table 14 is 1995, and so on. All of the tables have the same layout. 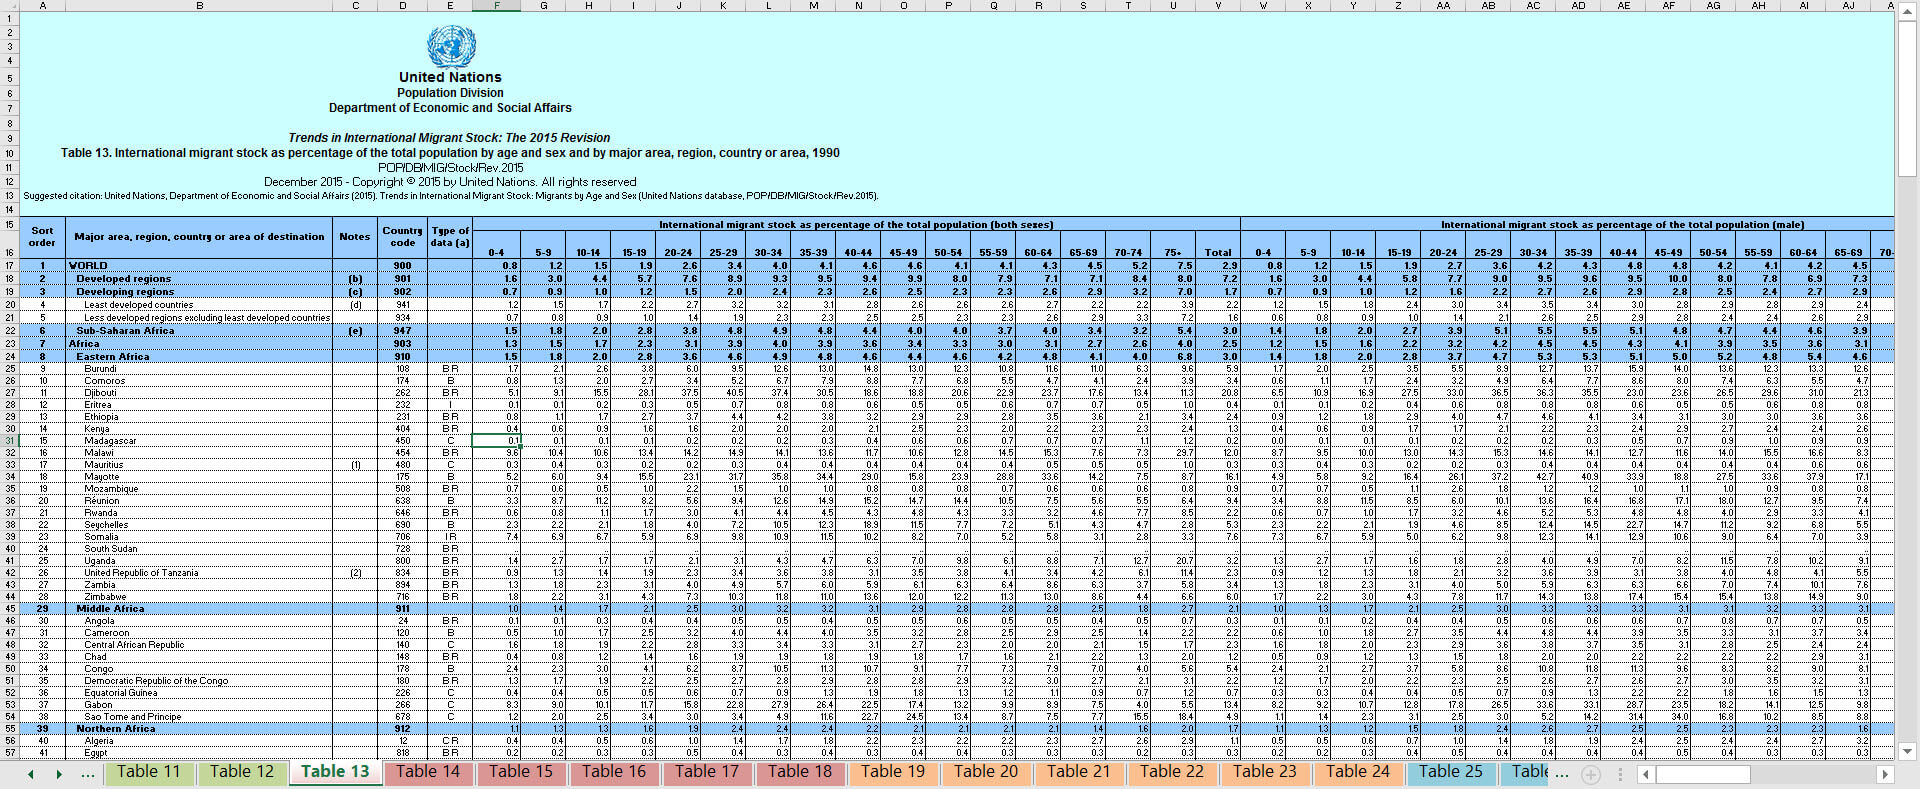
Alteryx
I found out all the Tables have the same schema and immediately went into Batch Macro Mode! I am going to set up all the tools needed to transform Table 13, and then transform that workflow into a Migrant Batch Macro and pass through the list of Tables to get all the data in one place.
In my first pass at building the Migrant Macro workflow, I used Regex and Filters to split the Excel sheet up into three workflows.
- Table Title

- Table Headers

- Table Data
It looked something like this:
Sadly, my Migrants macro errored out on its first run. I realised that each sheet was bringing in a bunch of extra unused empty columns or null columns. Unfortunately, the number of null columns differs table to table, so simply using a Select tool to get rid of them won’t work. I need a solution that works for all the sheets, so I built another macro! This is a standard macro that dynamically deselects all the null columns in a sheet.
I added the Remove Null Columns macro into my batch Migrants macro, and it worked like a dream!
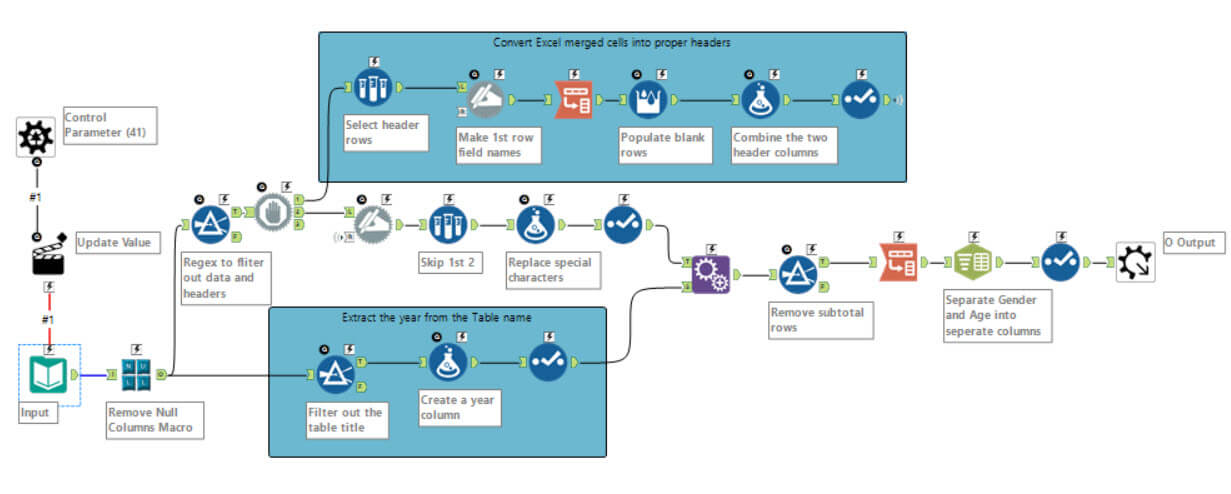
My final workflow was just four tools!
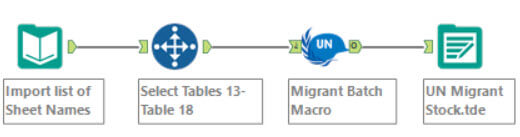
Tableau
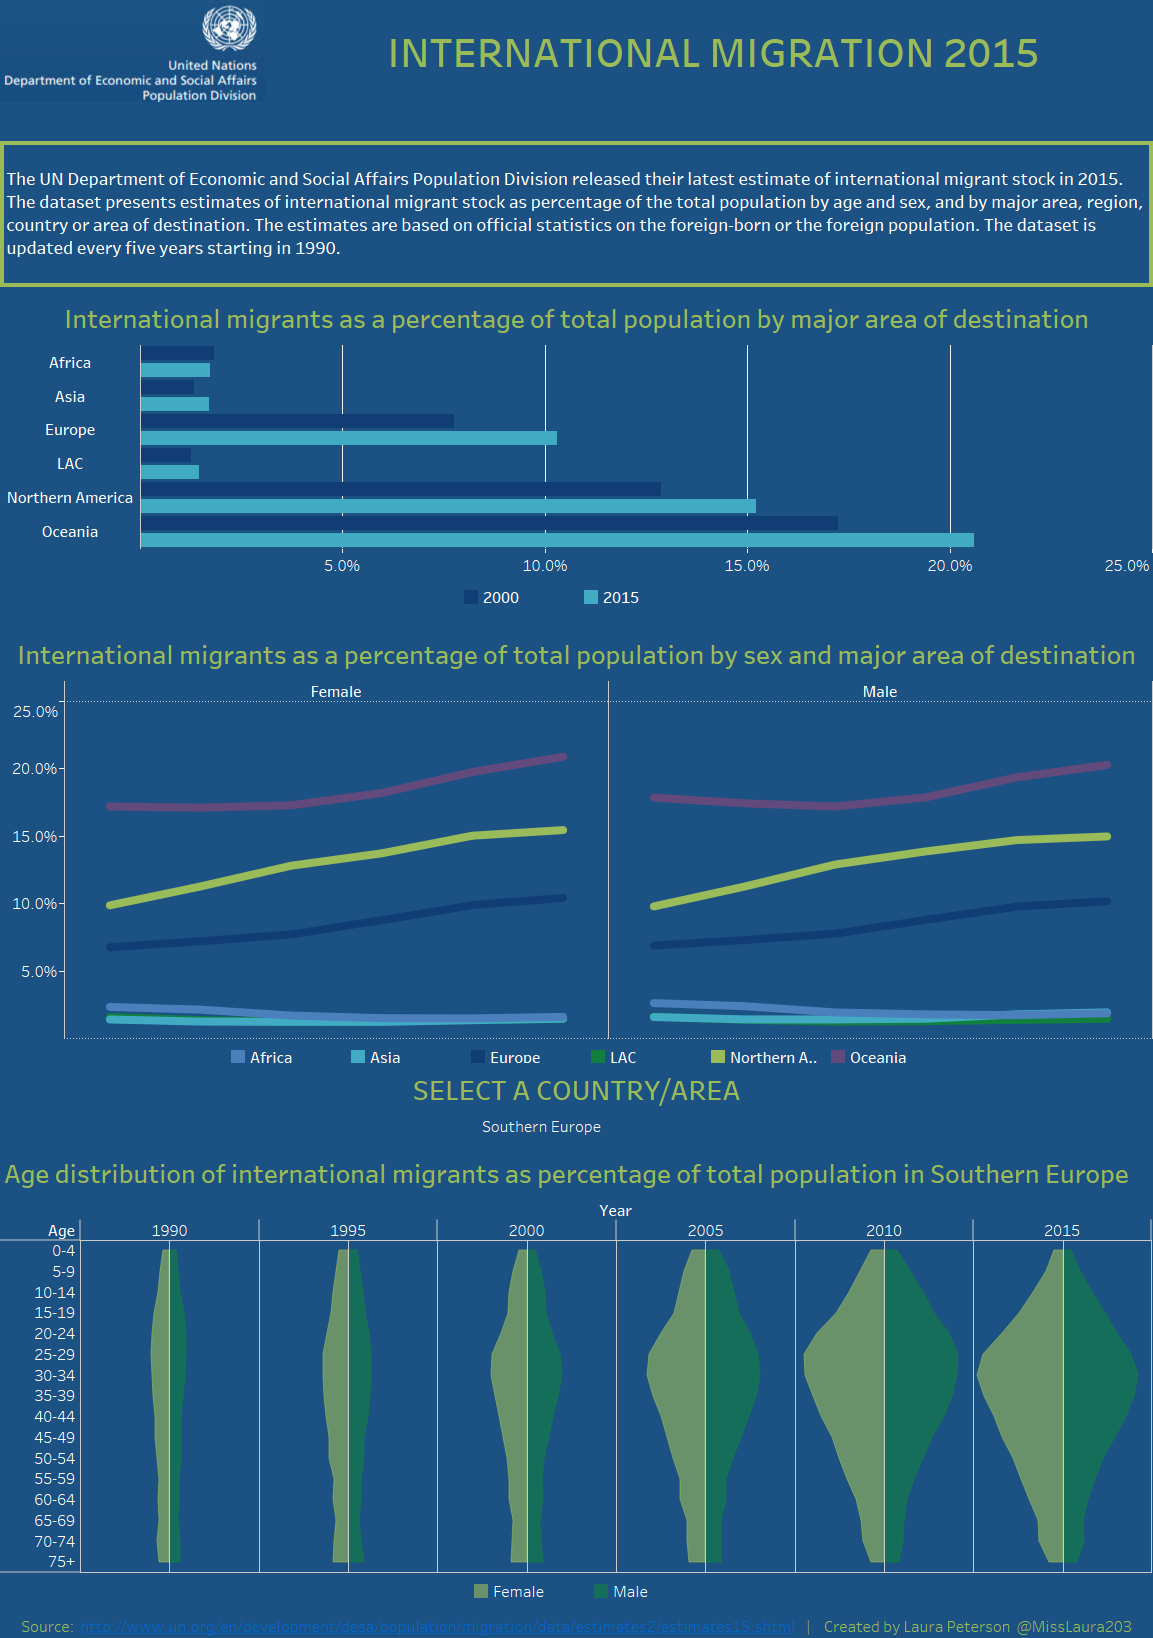
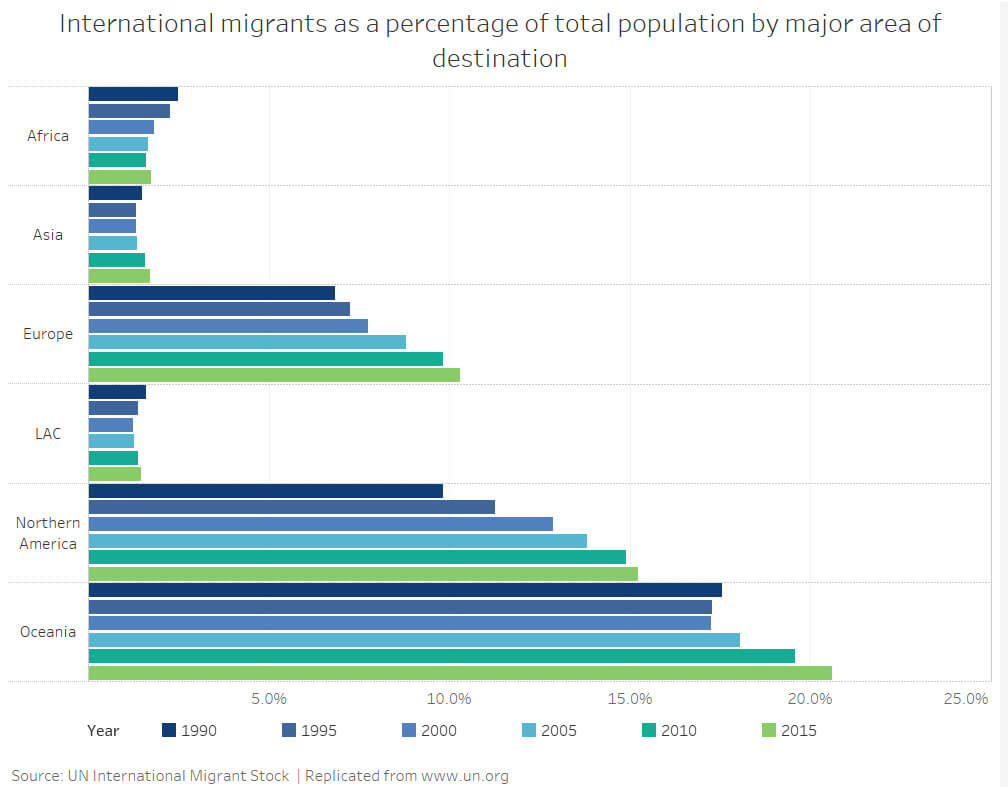
I have my .tde file, and I am ready for Tableau! Before diving into my Dashboard, I tested my data against the original to make sure I hadn’t cocked anything up in the macro. Instead of going back to Excel I recreated this chart from the UN website in Tableau. Result! A perfect match.
Now I can get busy vizzing! I have sketched out a few ideas and created this Pinterest board for inspiration
Dashboard