Today was yet another ‘Friday Project’. After a brilliant session by Anna Noble on blogging, we were given a new dataset to work with for the day.
Today, we were given the TFL data on bike journeys and bike stations. We then had 3 hours to analyse the data and present our findings (hint: STRESSFUL!)
I first looked at the data and what was included and using the lessons from Caroline Beavon, I started off sketching a few chart ideas. I then got extra excited when I drew a Sankey diagram and saw how well it would fit into explaining the data.
However, when I went about trying to create it, it began to take up a lot of my time, without much success. With only around 1 hour to go, I decided to abandon the idea and focus on what I wanted to show.
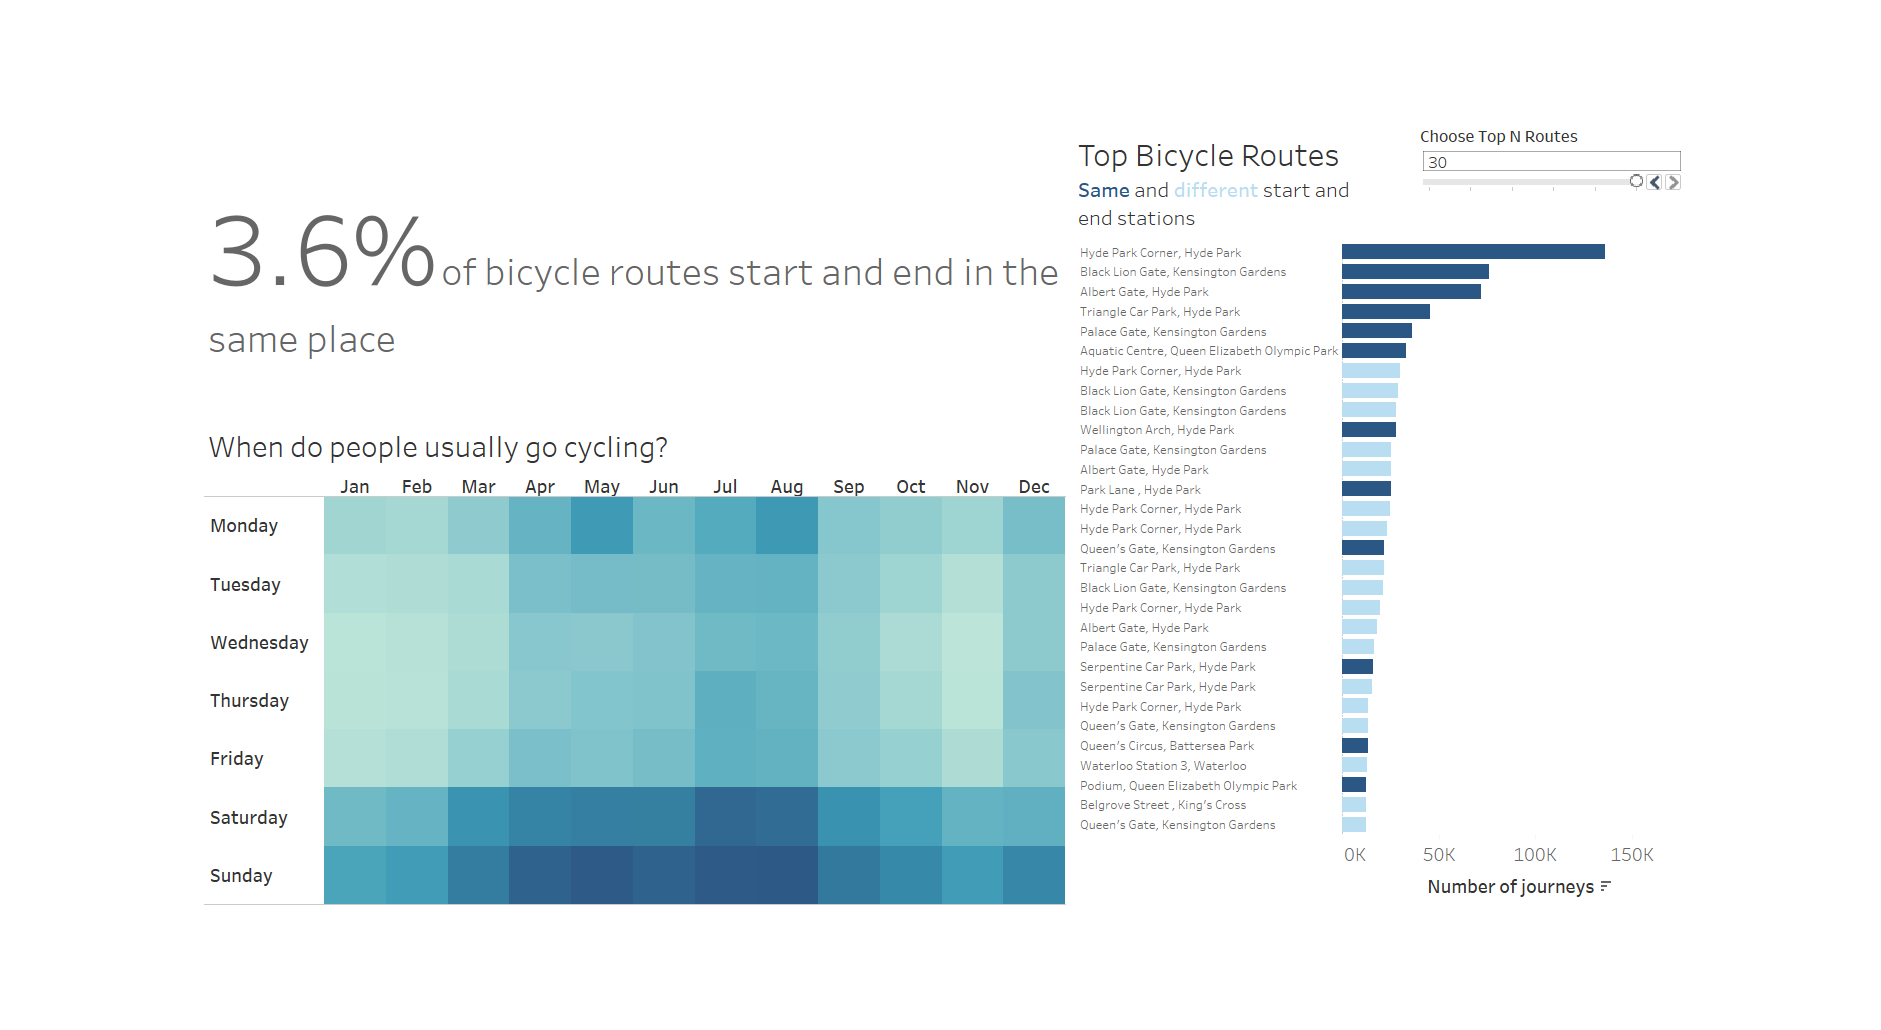
In the end, I came up with some good analysis on the top routes taken my bike riders with information on the most popular weekday and month. I also used a BAN (Big Ass Number) as part of my title; this is another thing I learnt from Caroline Beavon.
This has taught me to keep it simple, to provide some insight/analysis that is interesting and to look for a new perspective in the data.
A learning moment from today’s presentation:
- Always use titles to frame the main message of your data. Use it to hook your audience into your data visualisation. – This can easily be overlooked, so make sure you consider this when putting together your whole view.