Dashboard week is here! Today’s task can be found here in Andy’s blog post. We were supposed to use the data.gov.uk website to webscrape expense data for 391 trusts (or CCG’s) that spanned over 20 pages. Each trust had a link which took you to the page where you can download multiple datasets for each trust.
Web scraping:
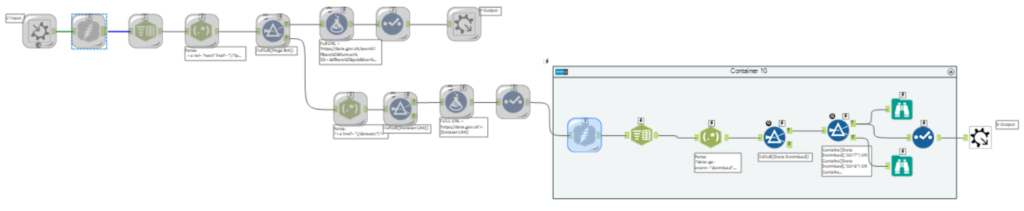
I knew straight away that I would need to use an iterative macro in Alteryx in order to download data from multiple web pages. The initial search page had a button at the bottom that said ‘Next’, so I was able to use the html code for this to generate the URLs for all 20 pages. However, when I tried to parse out the 391 Trust links from this I ended up with over 1000 links! I spent hours trying different methods to work around this but I eventually had to stop as I had a webinar to run at 12:00.
Soon after the webinar, a fellow DS13 cohortian had asked around and a core consultant figured out that all we had to do was uncheck the ‘Encode URL Text’ in the download tool on Alteryx. It was quite frustrating because I felt I had wasted a lot of time and there was a simple solution. Lesson to be learned, ask around sooner!
After downloading all the CSV and Excel files I could find, I realised that there was over 900 files and almost all of them had different data layouts (different fields and order of fields). This would be impossible to do in one day so Andy kindly allowed us to pick one trust to focus on.
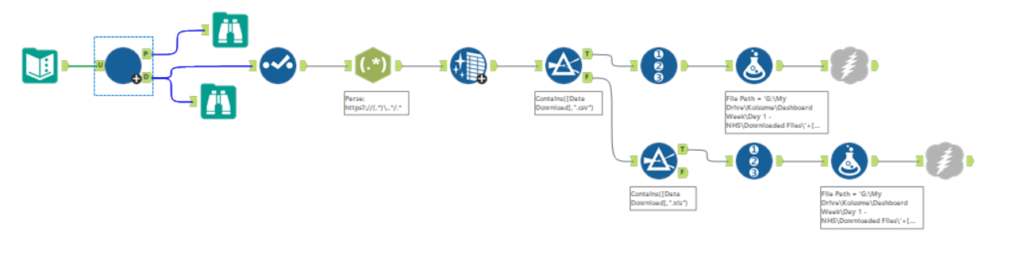
I used a wildcard to input all the Isle of Wight files into a new Alteryx flow and prepped my data to use in Tableau.
Vizualising:
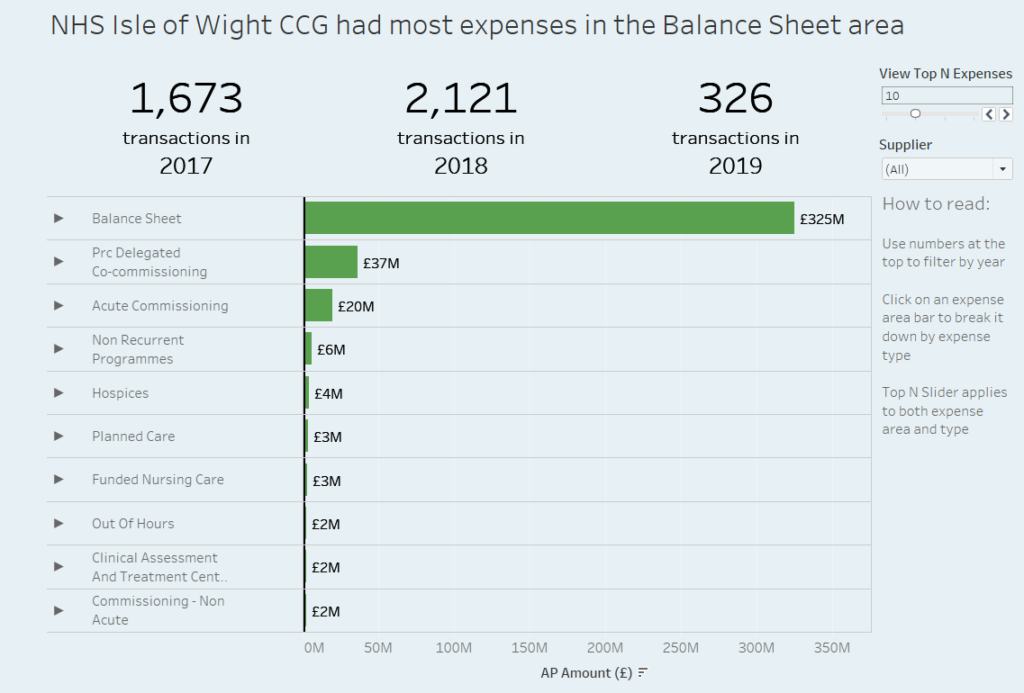
I decided I wanted to incorporate time data in my visualisation and decided to use BANs for each year, with a count of the number of transactions in each year. I planned to use these BANs as a method of filtering my chart below by year.
The main chart is a simple bar chart with the sum of the transaction amounts, split by expense areas. I used set actions to allow the user to drill into specific expense types. Both expense areas and types are limited to view the Top N bars, which I have allowed the user to specify with a sliding parameter. Lastly, I added a filter for Suppliers.
Overall thoughts:
Although it felt intense and pressured, I quite enjoyed this task. It was good that we were able to talk to the coaches about issues we were having, most of which they did not expect themselves. This way the task requirements could be updated so it wasn’t so impossible. Having the ability to do this definitely helped to stop me from freaking out! Although this may not be the best visualisation I’ve created, I feel as though in this task I was able to practice my webscraping and I was happy to see how much I had remembered from my training here at the dataschool. I look forward to the next challenge!
Thanks for reading!