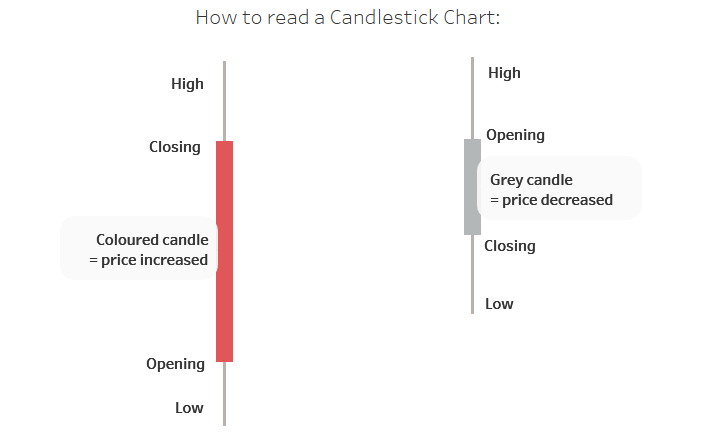
Last Friday at the dataschool, DS13 were tasked with convincing the audience to invest in particular shares using data visualisations (experts spend hours trying to do this so I’m not sure why the coaches felt we would manage this enormous task!). I searched online for inspiration and candlestick charts came up, also known as OHLC charts (Open-High-Low-Close).
You can use any company’s share price data, but I would advise you use the same source as me so you can follow easily with the same field names. You can download full historical shares data for a company of your choice through yahoo.finance.com.
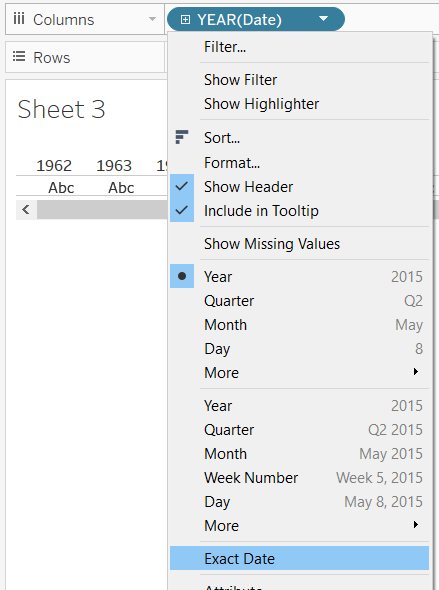
Step 1: Drag your Date field from your dimensions onto your columns. Change the format to Exact Date.
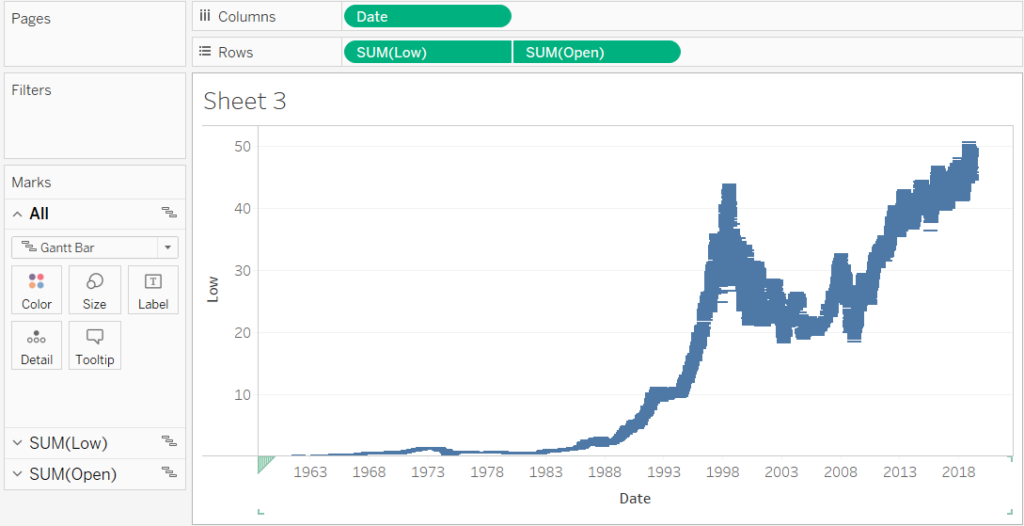
Step 2: Drag Low from your measures onto your rows. Next do the same for Open.
Step 3: Right-click on your Sum(Open) pill on your rows and select Dual Axis. Now right-click on a vertical axis and select Synchronise Axis. Right-click on the axis on the right side of chart and deselect Show Header. Double-click on the axis on the left side of the chart to format it, make sure Include zero is unchecked.
Step 4: On the All marks shelf, change the chart-type to Gantt Bar, and remove the colour field so everything is the same colour. I know, it’s a mess now but it will be clearer soon!
Step 5: We need to create some calculations to fill the space between the opening price to the closing price (to form the candle bodies), and the highest price to the lowest price (to form the candlewicks). Here’s the two calculations:
Close-Open Gap:
SUM([Close])-SUM([Open])High-Low Gap:
SUM([High])-SUM([Low])Step 6: Drag your High-Low Gap calculation onto the size marks card for on the Sum(Low) marks shelf. Then click on the size marks card and make it as thin as a candlewick! You can also change the colour on the colour marks card.
Step 7: Drag your Close-Open Gap calculation onto the size marks card for on the Sum(Close) marks shelf. Then click on the size marks card and make it thick enough for the body of your candles.
Step 8: We need to create another calculated field to colour the body of the candlesticks based on whether the share price increased or decreased, and to update in the tooltips. This is determined by whether the share price was higher at the end of the day than the start of the day, in other words, this is the closing price minus the starting price so we can use our first calculation within this new calculation.
Price change:
IF [Close-Open Gap] > 0 THEN "Price Increased"
ELSE "Price Decreased"
END
Step 9: Drag the new calculation onto the colour marks card on the Sum(Close) marks shelf, as we only want the body of the candle to change colour based on the price change. You can click on the colour marks card and go to edit colours further.
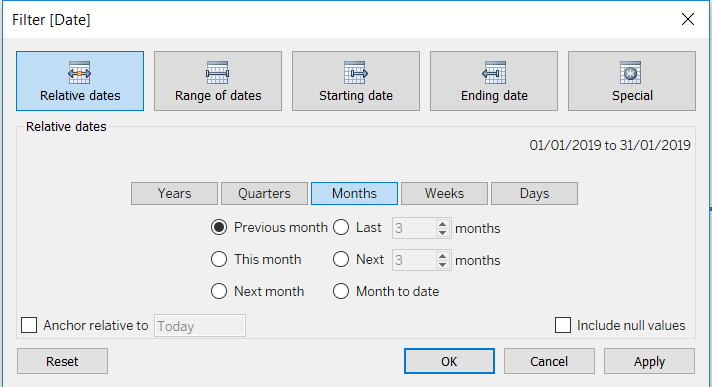
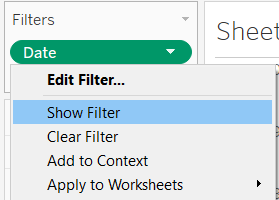
Step 10: The bulk of the work is done! We just need to put in a date filter to be able to zoom into the data so all the candlesticks aren’t cramped together. Drag the Date dimension onto the Filters shelf. Select Relative Date and click next to set up your filter. Once you’ve set it up, right click on the pill on your filters shelf and click show filter.
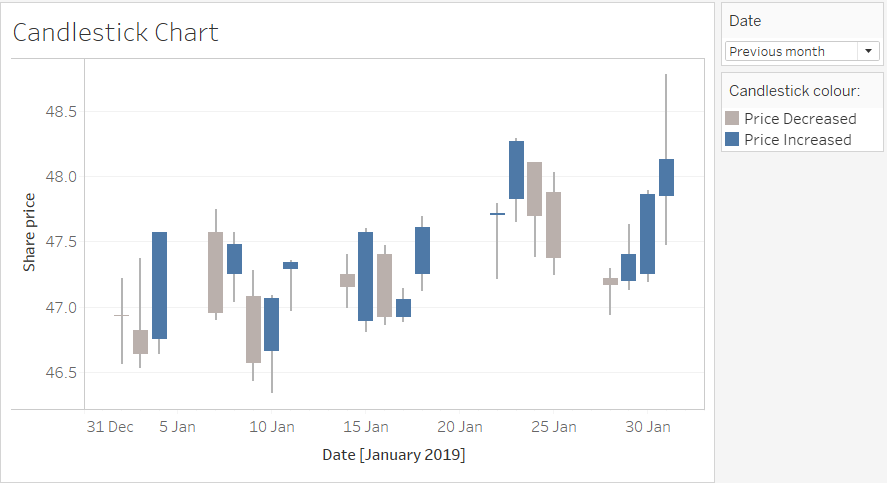
Finished example:
Also, check out the dashboard I made for my project using this method by clicking right here!
Thanks for reading! If you have any comments or anything is unclear, please just ask.
~Kolsuma