Dashboard Week day 2!!! We began the morning by showing our work from the previous day to Andy who is currently living it up in Ireland. After he gave us feedback on our explicit vizzes, he briefed us on our next challenge:
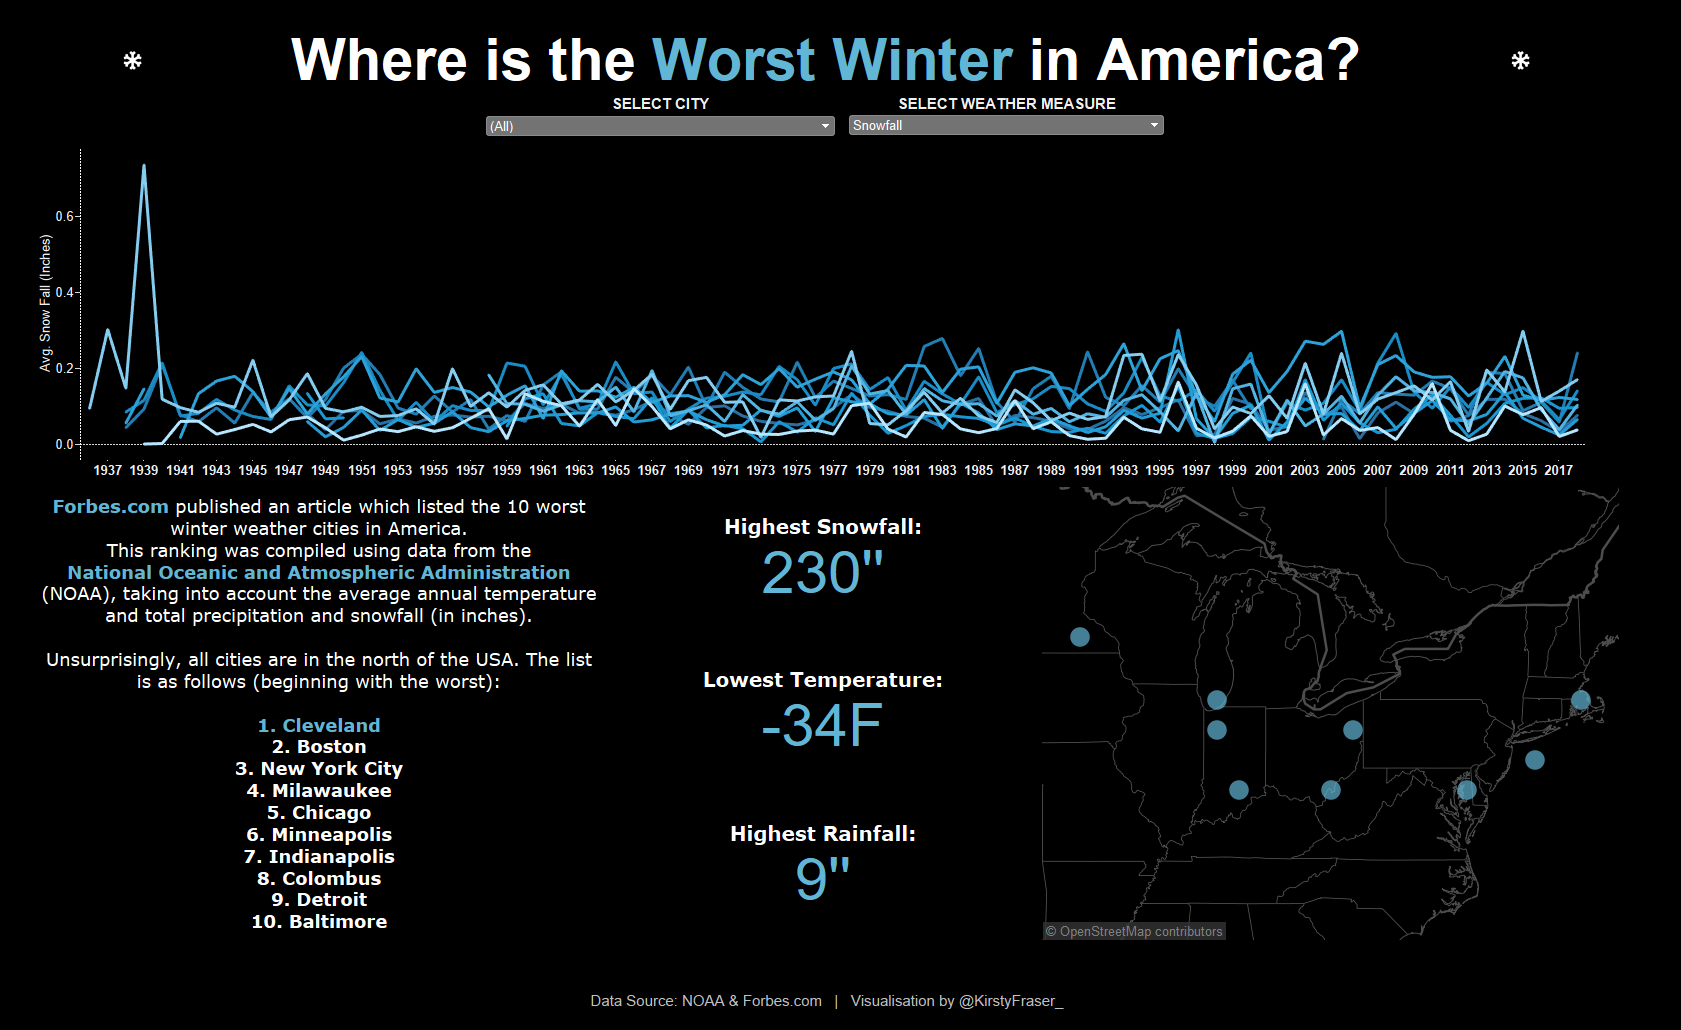
Get data from The National Oceanic and Atmospheric Administration – specifically at a daily weather station level- and then… *drum roll* visualise it in Tableau! The website requires you to search by specific terms- my initial plan was to do a project on my lovely motherland, Scotland, but there was a depressing lack of weather data for a country which rains 90% of the year. So I tried a few different places and finally came across a Forbes.com article using the same datasets which ranked the top “10 worst winter weather cities in America (which is a bit of a mouthful).
I decided to investigate and compare these 10 cities based on the factors mentioned in the article- precipitation, snowfall and lowest temperatures reached. There was talk within DS10 of using APIs and iterative macros and other fancy jargon but it soon became clear I would also have to download the data from each city station manually- yes, manually. This involved searching every city from the top 10, selecting which station best met my criteria (most of data started from 1940 ish to the present day) and then getting it emailed to me as a CSV. Because there was a limit on how much you could download, I needed got three CSVs emailed to me, one after another- which was quite a faff, to be honest.
Then it was time for Alteryx! I unioned all my data together in a simple workflow then joined on the rankings from the Forbes list.
 Just as I was beginning to tinker around with the outputted data in Tableau, we received less than ideal news: Andy wanted us to produce the final dashboard with Tableau Version 9 (that’s 10,000 BC in Tableau years).
After some initial resistance, we downloaded Version 9 and…
To be honest, it wasn’t as bad as I feared. It’s definitely less pretty and user friendly than its predecessors, but most of the essential commands and actions you need are there.
I’m hoping to do a little more tweaking before posting to Tableau public, but here’s what I came up with thus far: