


"The PostgreSQL repository database that powers Server is a maze of confusing tables and cryptic, often incomplete, data" (https://github.com/tableau/community-tableau-server-insights)
We can use the different data sources to ask different questions about our users, sites, activity etc etc.
I chose to use this to look at when the different sites see the most user activity and server activity.
The 'Actors' are the looking at the users of Tableau server and when they are the most active.
The 'Events' are the activites taking place on server, these could be scheduled updates etc.
So to firstly look at when we see the most site activity from different users, I wanted to look at activity over different hours of the day and give the option to look at this at a site level.
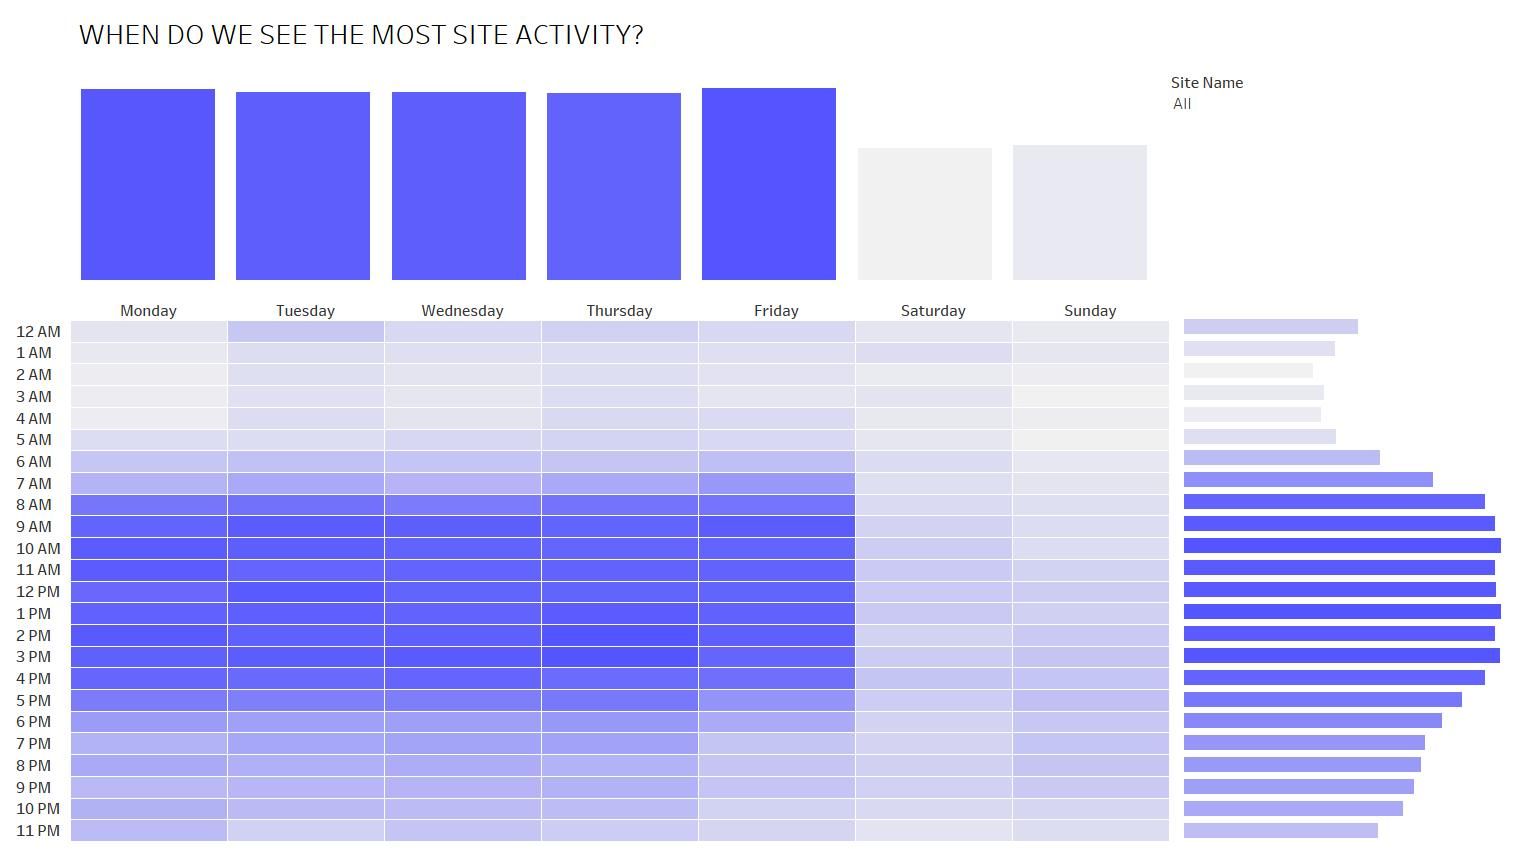
When looking at the the site acivity on a user activity level, the findings were as expected. We can see the most activity Monday-Friday from 9am-4pm.
I then moved on to looking at the the events happening on the server on an hourly level for each day to see how this compared to the user activity.
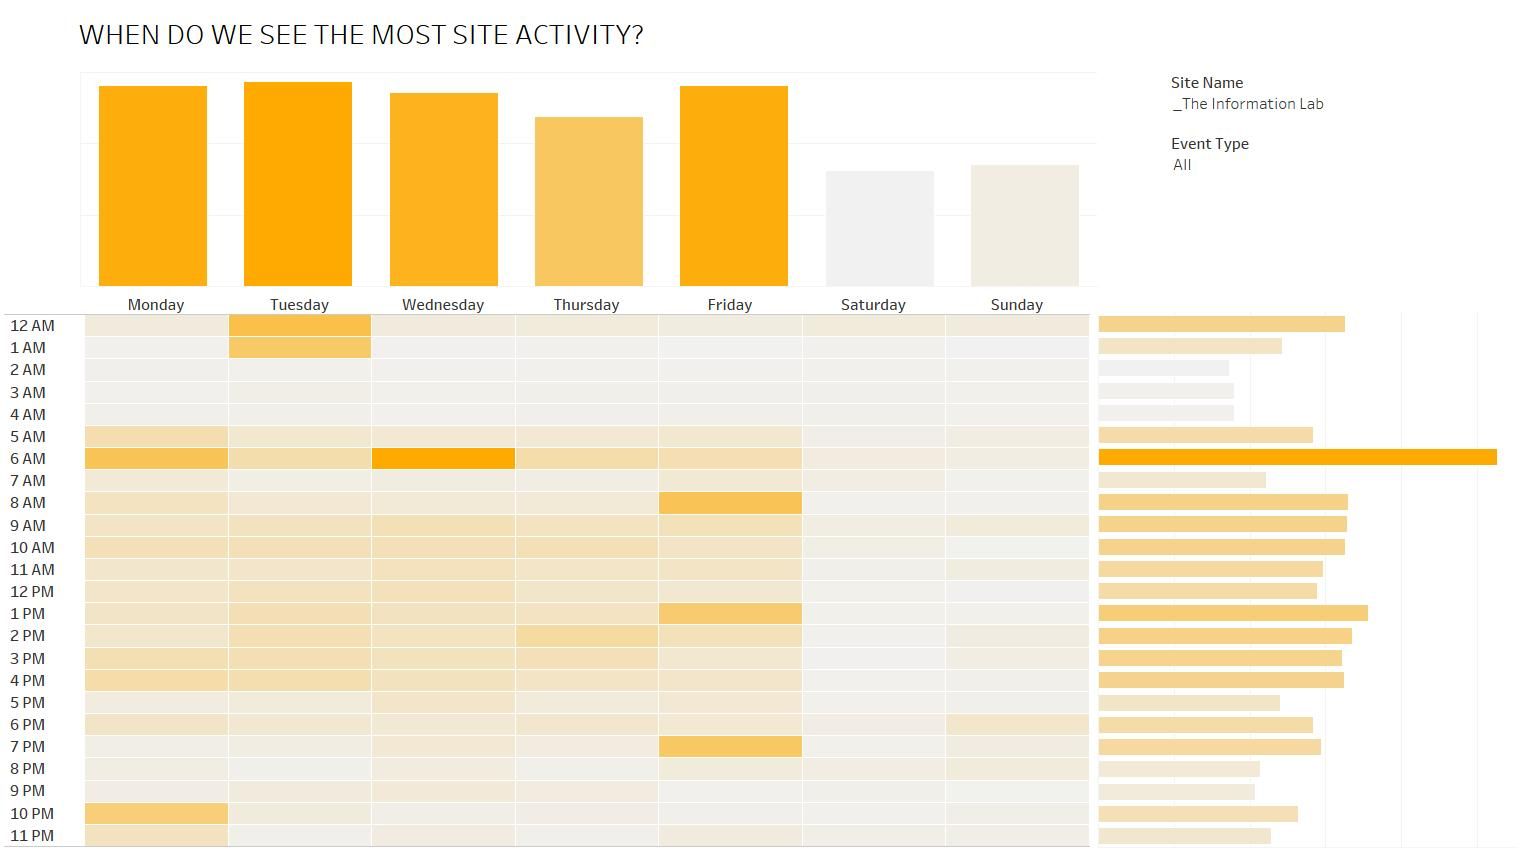
This dashboard focuses more on server activity and what events are running on the server and at different times. I found that the highest number of events running at any time took place on Monday at 6am - and this is mainly Email Subscriptions.
Something to bear in mind with my analysis - I looked at all the data within the view (2021-2022) but it would be more benefical to view this over a rolling 6-month period for the most recent data!