For our first day of Dashboard Week we were given a data set about New Orleans Police Body Worn Cameras. You can view the data set here: https://data.nola.gov/Public-Safety-and-Preparedness/NOPD-Body-Worn-Camera-Metadata/qarb-kkbj
The data had 4 million records which included the location, date, police district etc. and we were able to use another data set to suppliment this if we wished.
I found another data set which included different types of police incidents for each of the districts over the years, and a shape file that could be used for the districts as the incident report didn't include exact location data to match the other data set. Our original data set included 2014-2022 so I found the incident reports for each of these years which can also be found here https://data.nola.gov/browse?q=Electronic+Police+Report+2022&sortBy=relevance&page=1
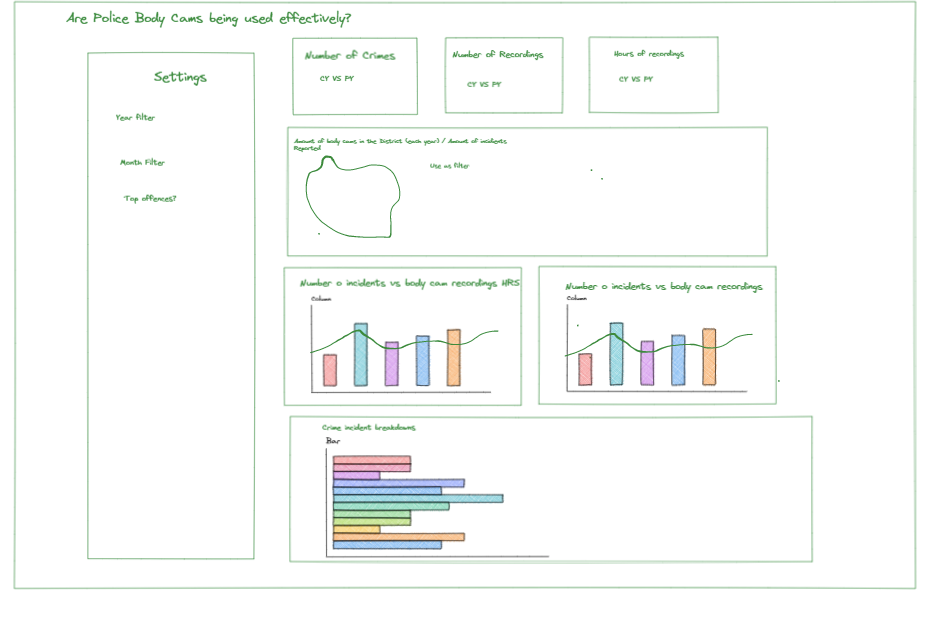
I sketched out the graphs that I wanted to build for the dashboard after looking at the fields I had to work with
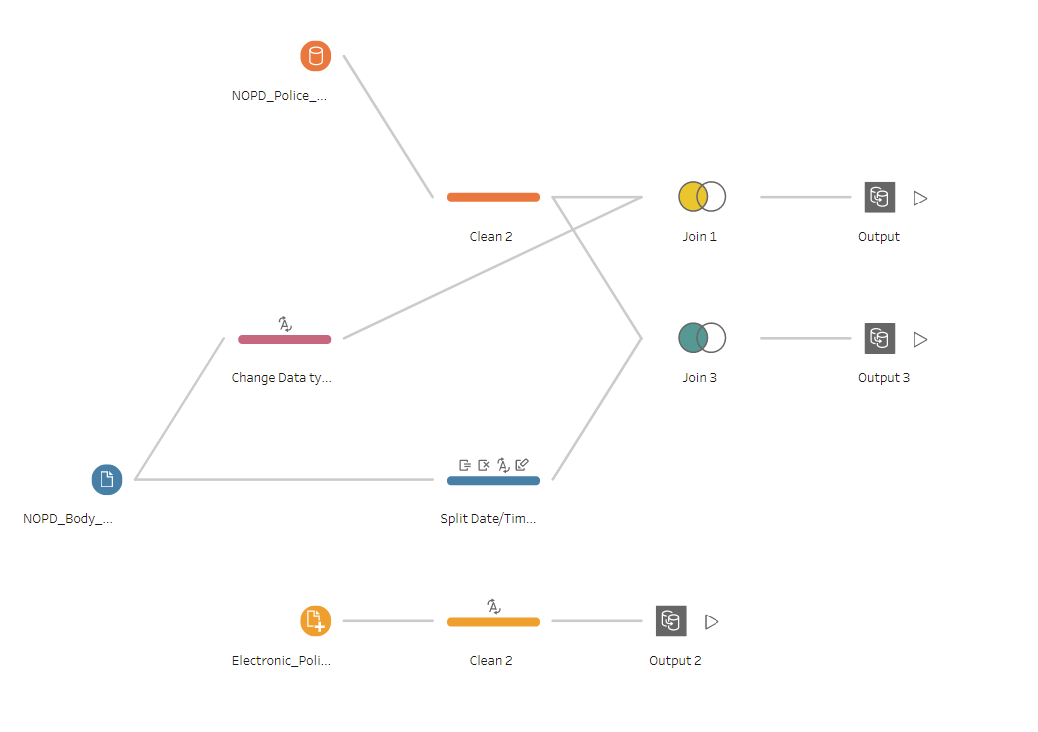
I used Tableau prep for this data with the view to clean up the Body Cam data and join this with the shape file, and also union the yearly incident report data sets.
I used a relationship in Tableau Desktop to bring the two datasets together. I did have a few issues with the relationship as I'd planned to compare the incidient data set with the body cam data and had only used the 'District' field for the relationship, when adding in the date fields too the numbers weren't matching up (this may have just been something I was doing incorrectly)
However, I was able to use a calculated field in the relationship to just bring back the month and year for each of the data sets - this seemed to work so I stuck with this level of granularity.
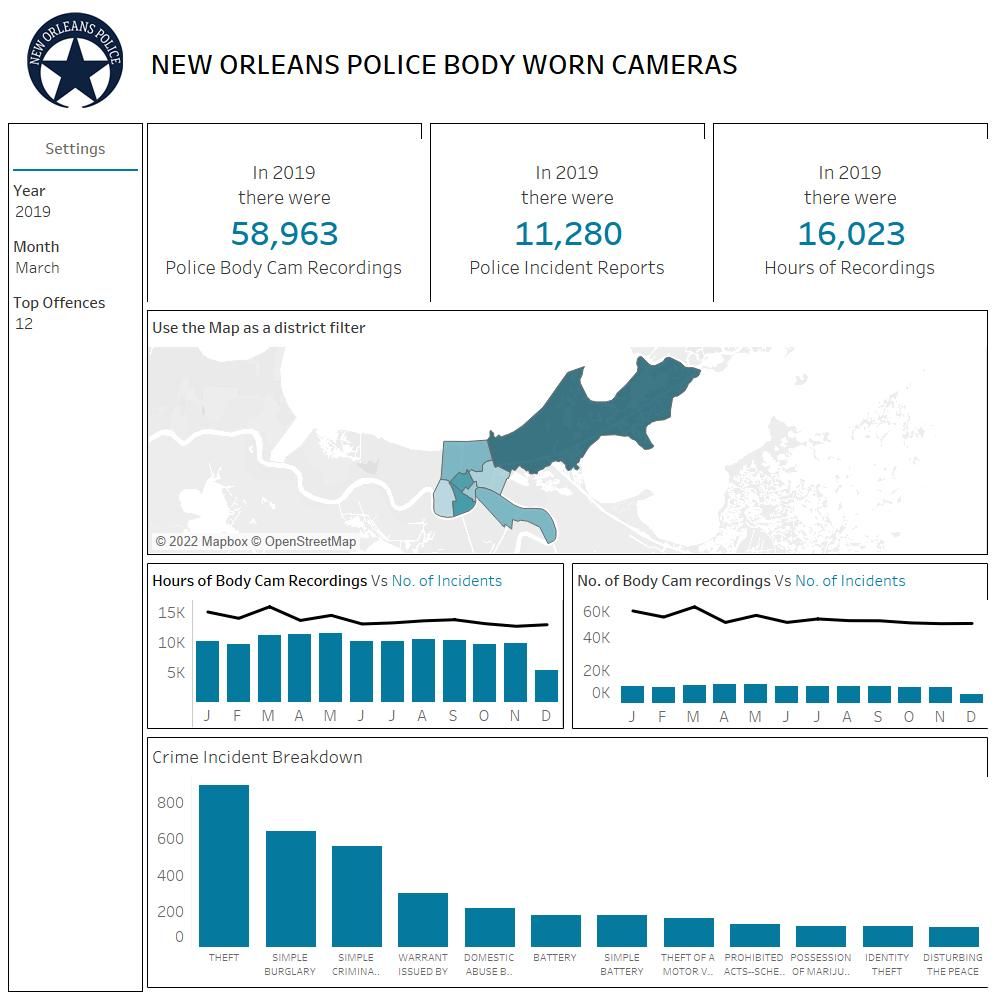
I managed to put together the graphs I had planned but there's some finer detail I didn't get round to finishing such as the % changes of current year to prior year in the BANs (this is almost done but I wouldn't have had time to finished this blog!)
So here is my final dashboard: