


I started training October 3, 2022 and today is October 28. In that time, our cohort has gotten a wide spread of tools to be acquainted with. Subtracting the week we spent with Tableau Prep Builder and a week with Alteryx, we had roughly a week and a half of Tableau Desktop training. In that short time, our cohort has been eager to touch on as much as we can in Tableau. Thanks to our Coach, Ann Jackson, this is some of the stuff we’ve learned so far:
Charts I’ve built (using Superstore Data):
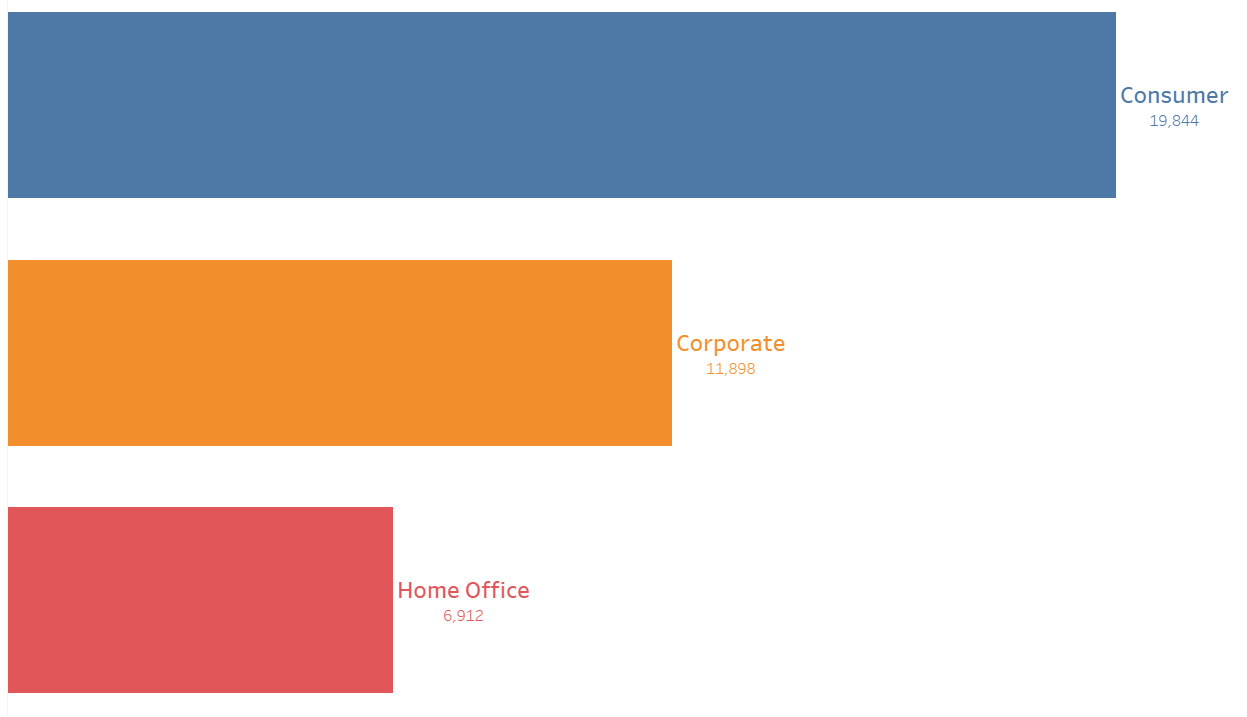
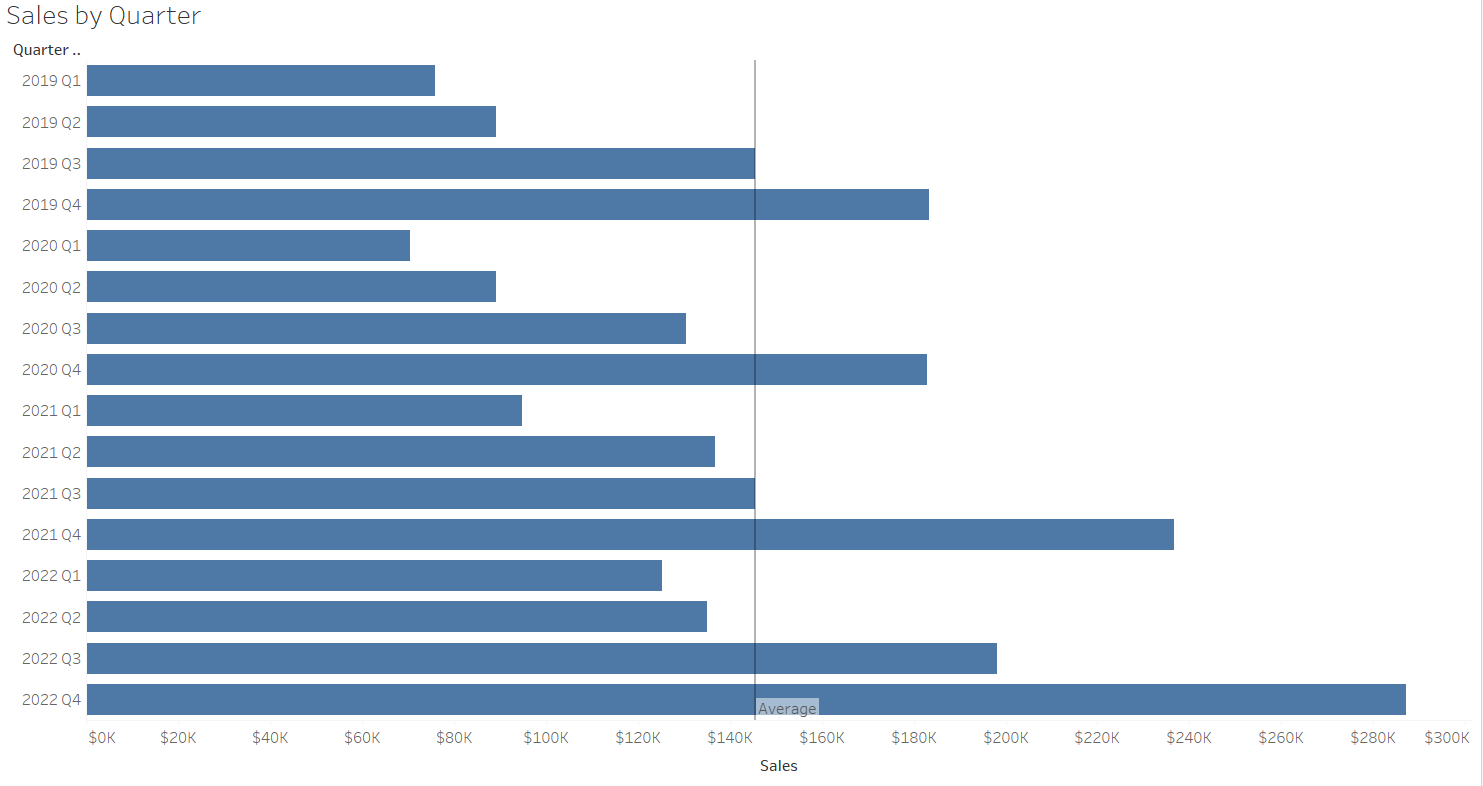
Bar charts
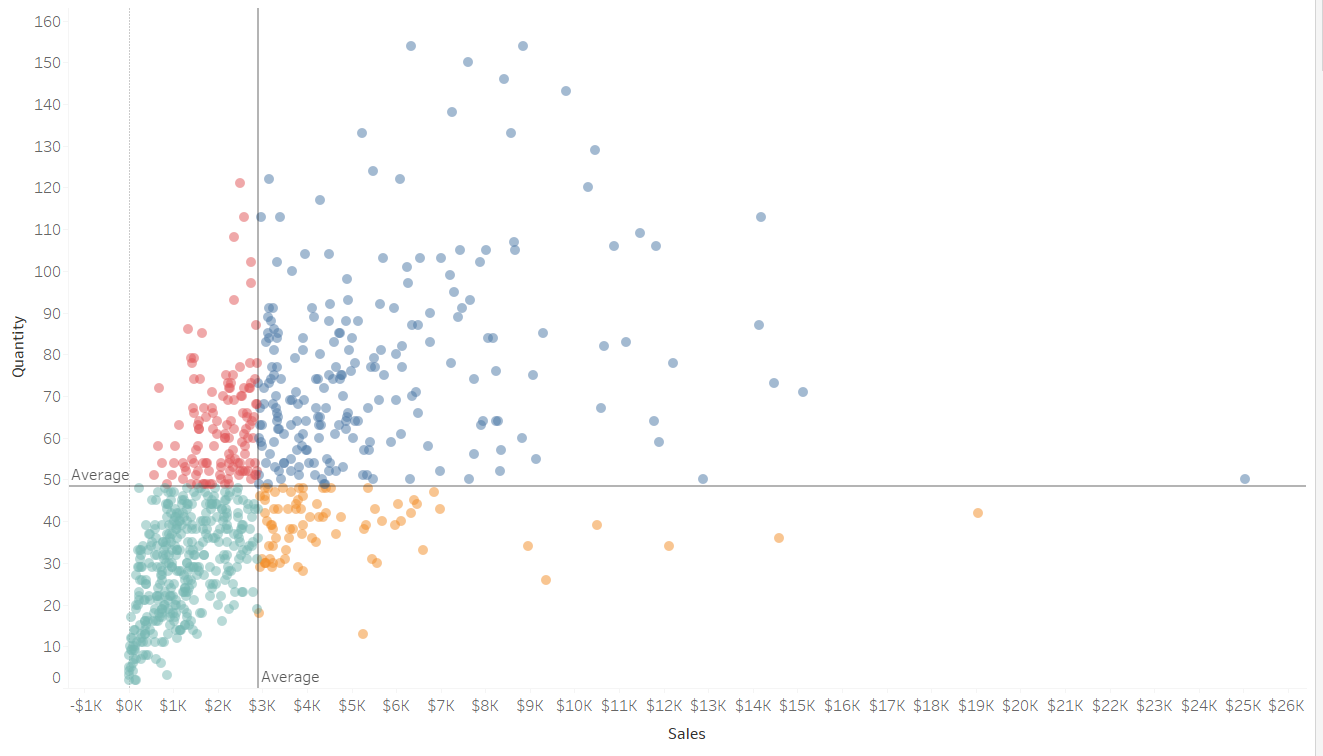
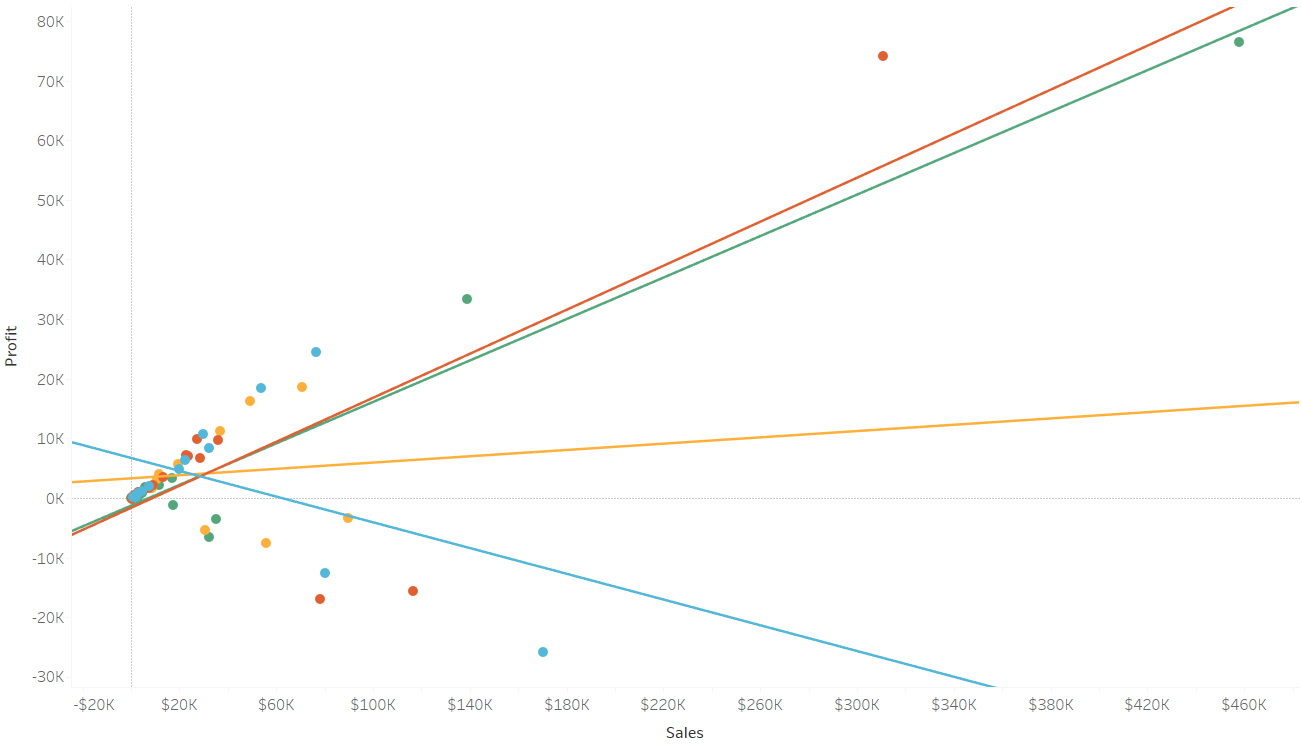
Scatter plots
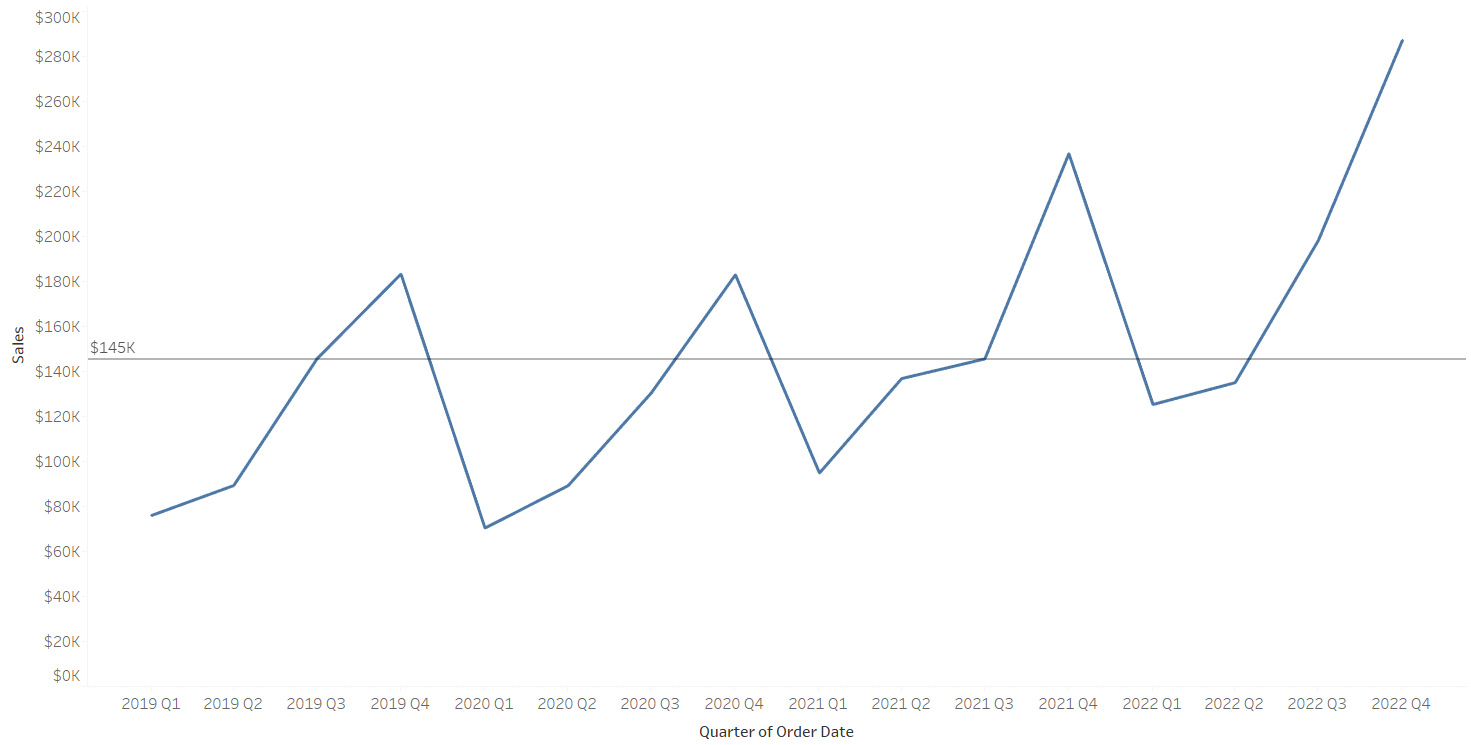
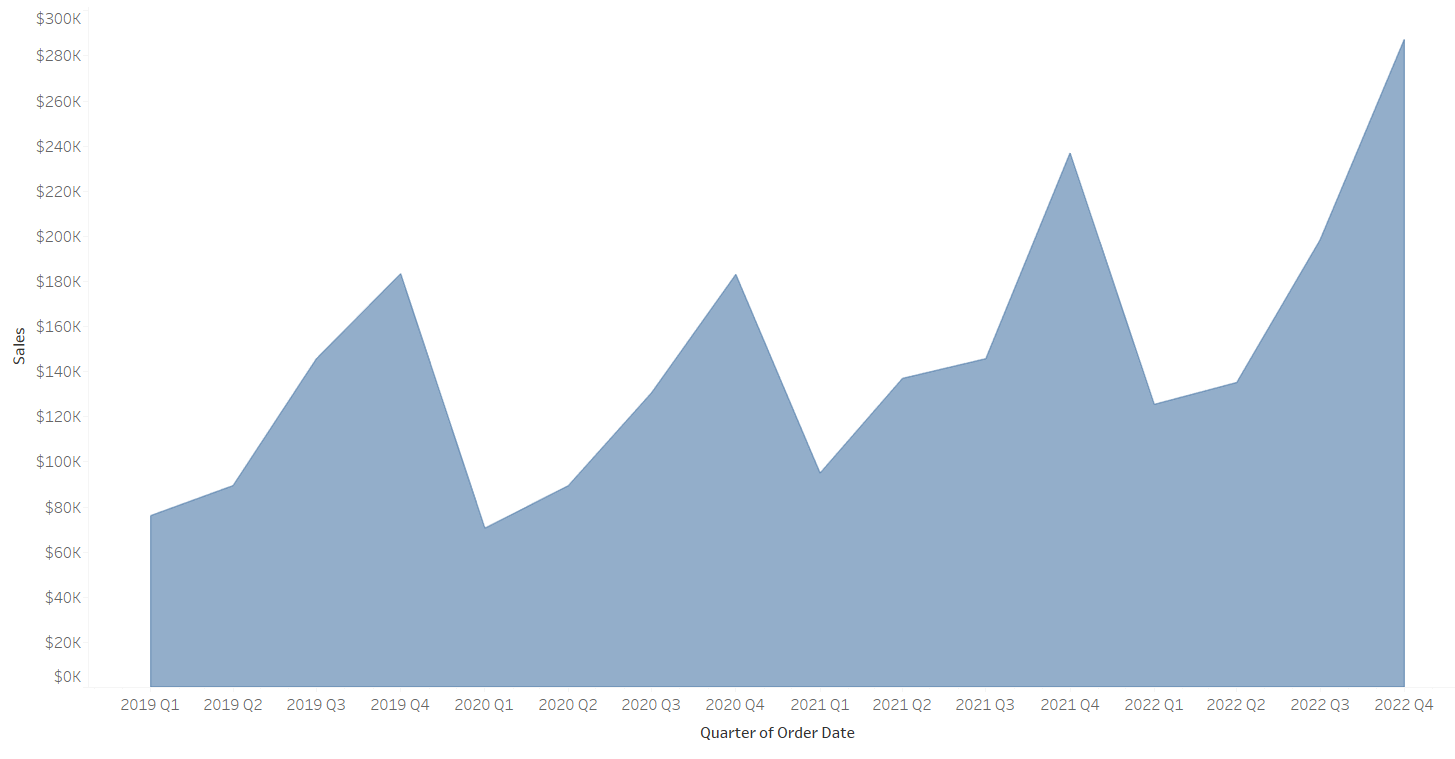
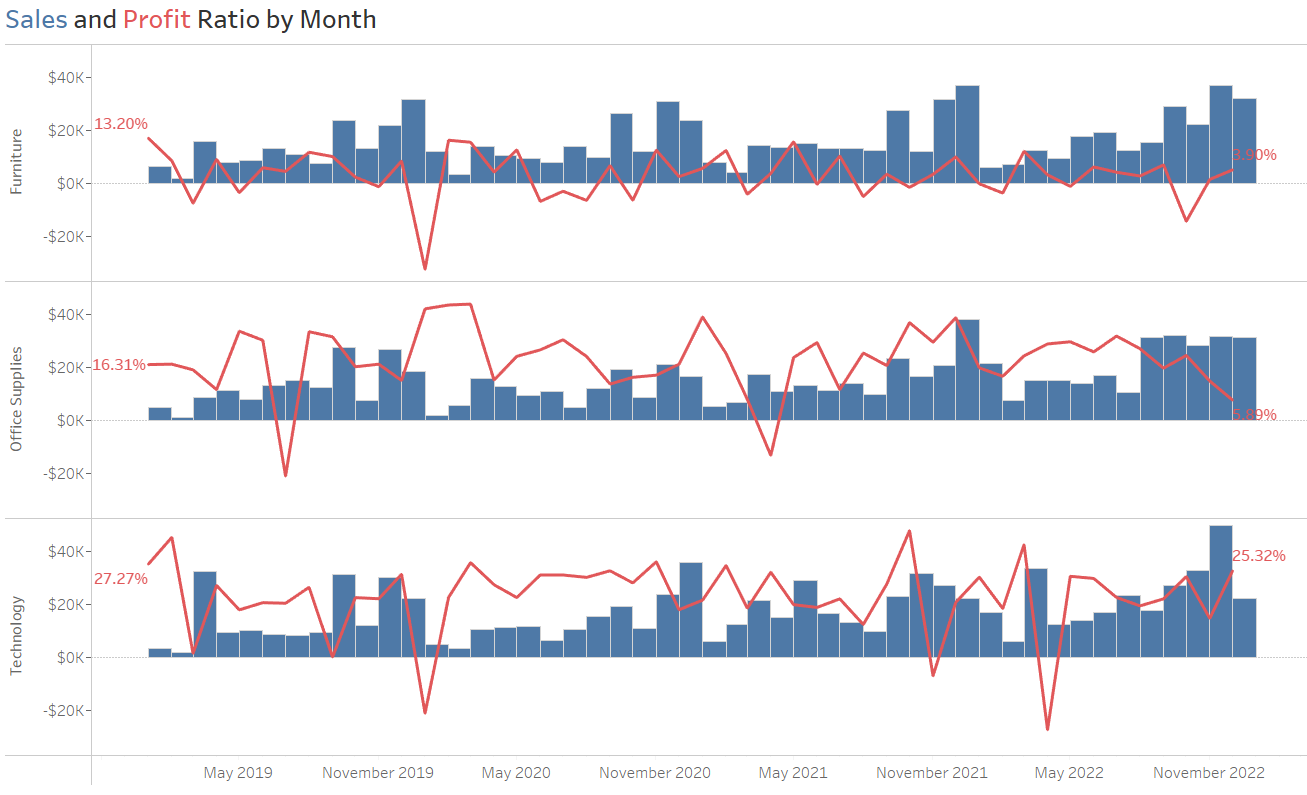
Line charts
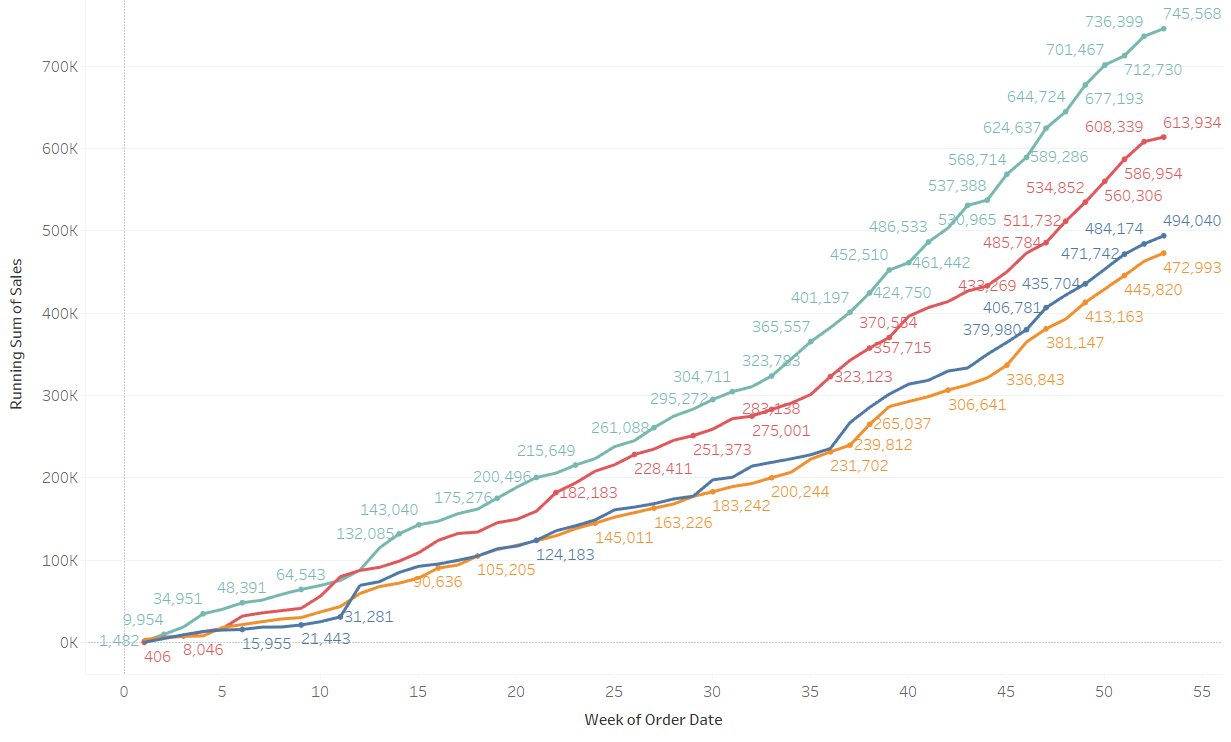
Cumulative line charts
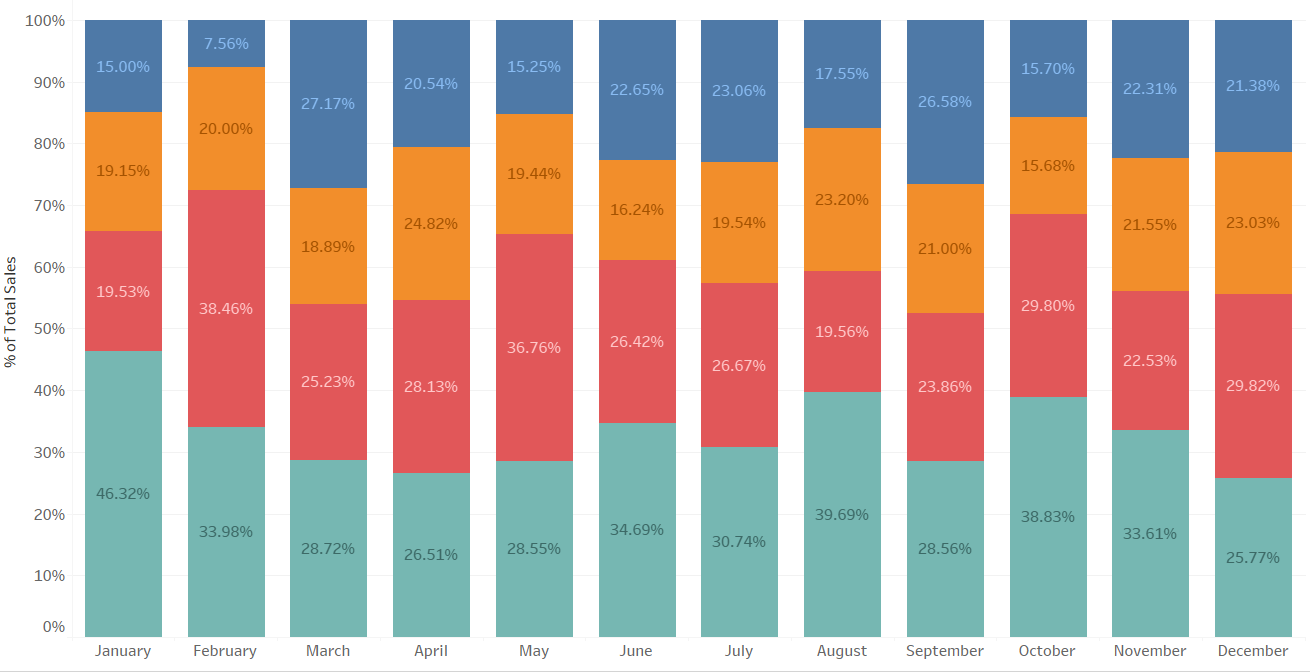
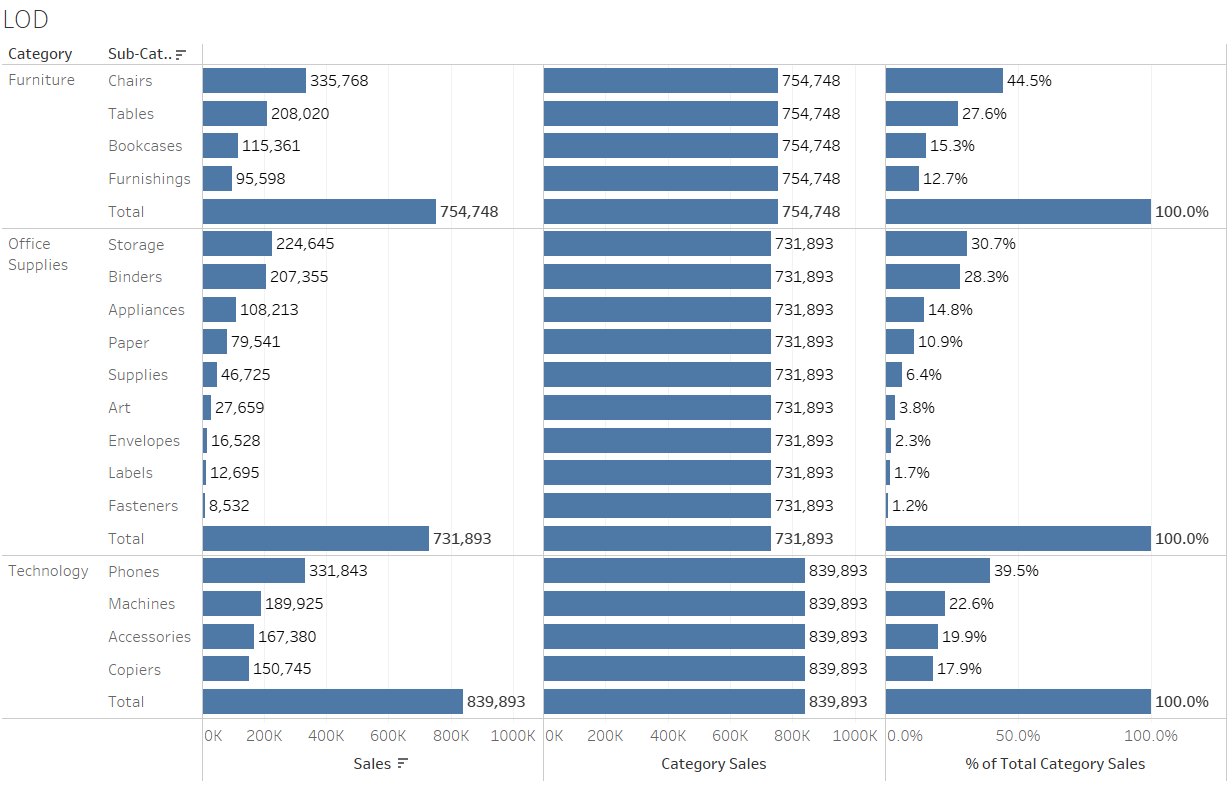
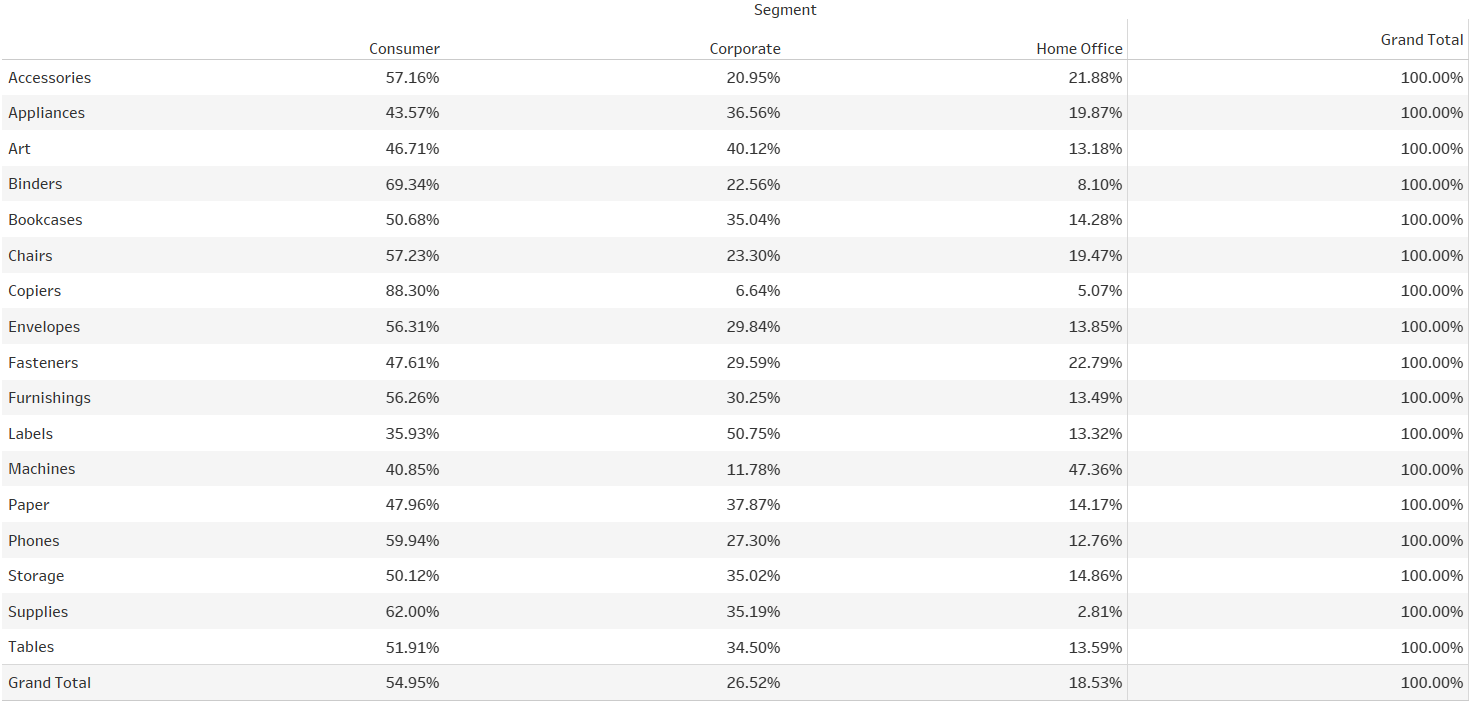
% of total & stacked bar chart
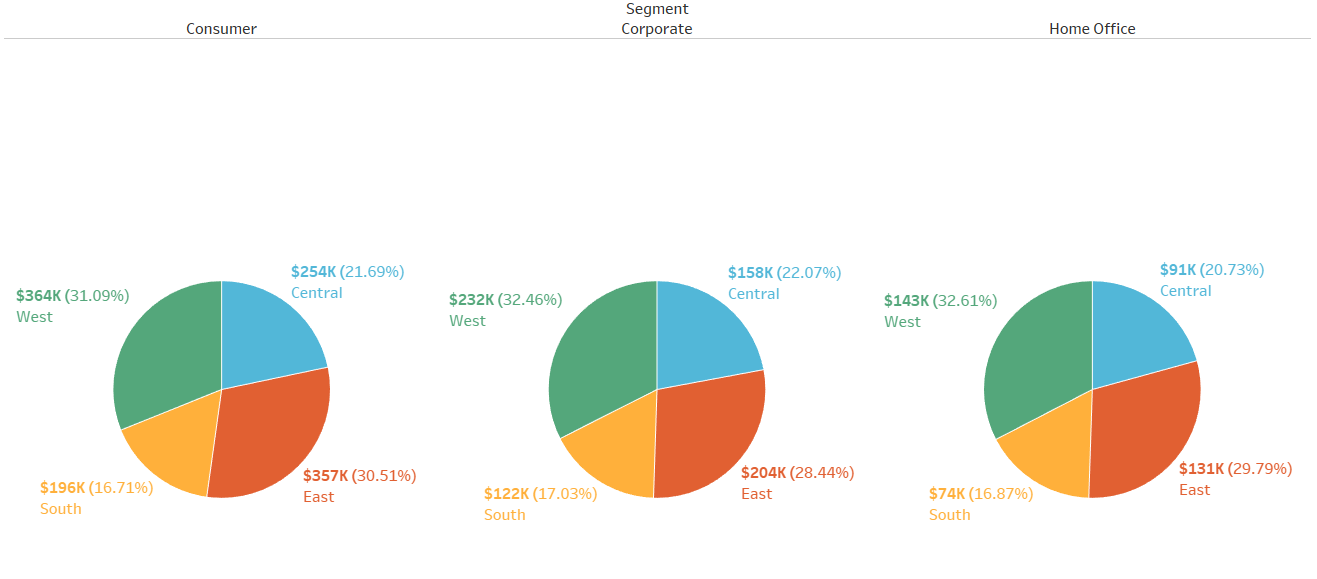
Pie charts
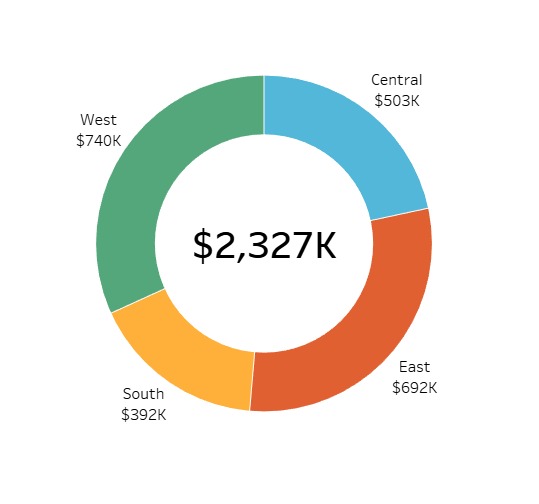
Donut charts
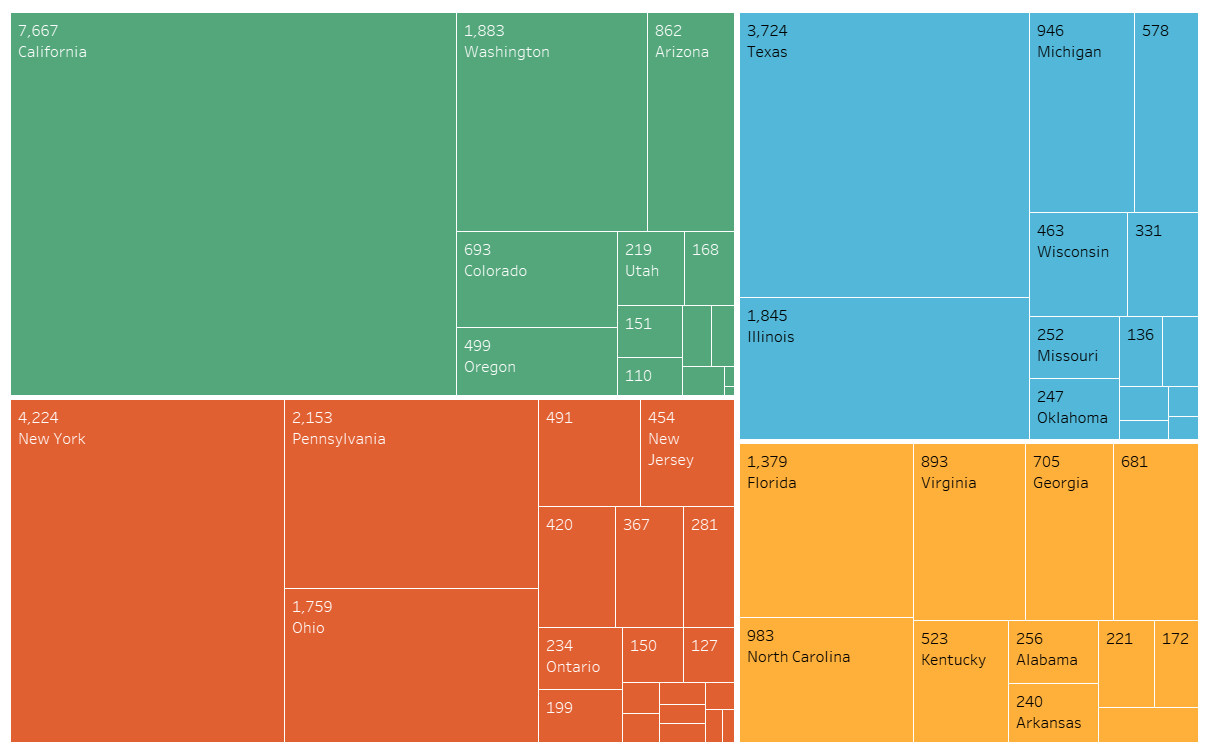
Tree Maps
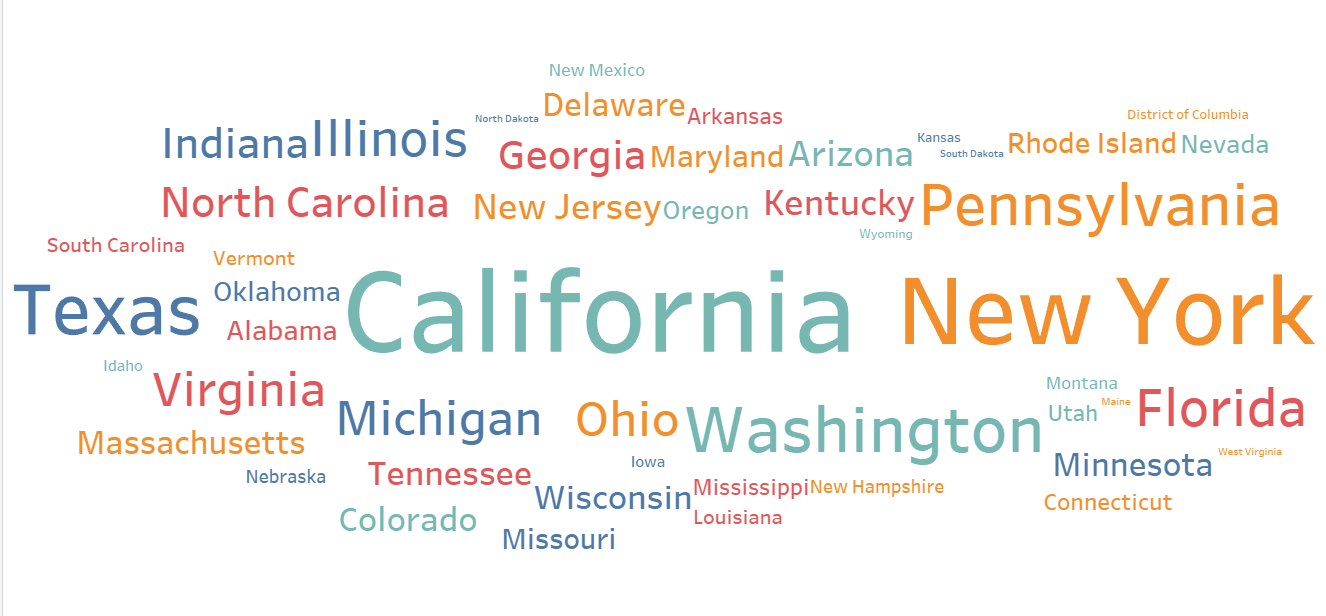
Word clouds
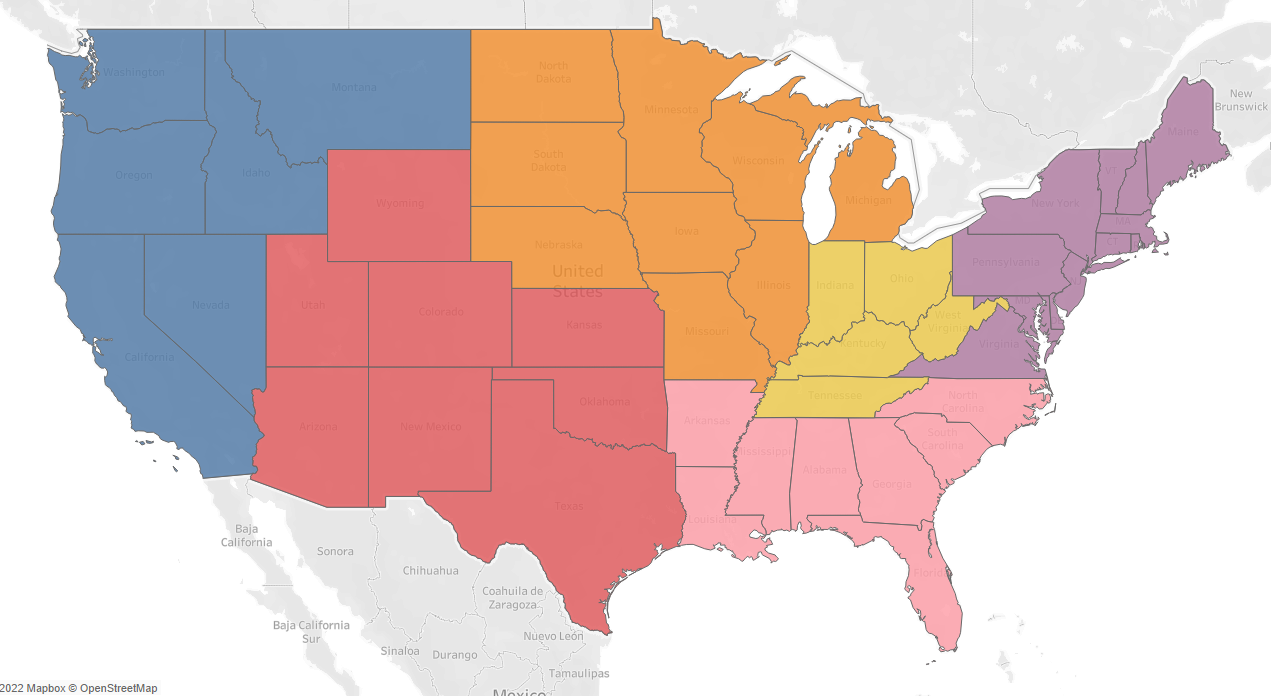
Maps
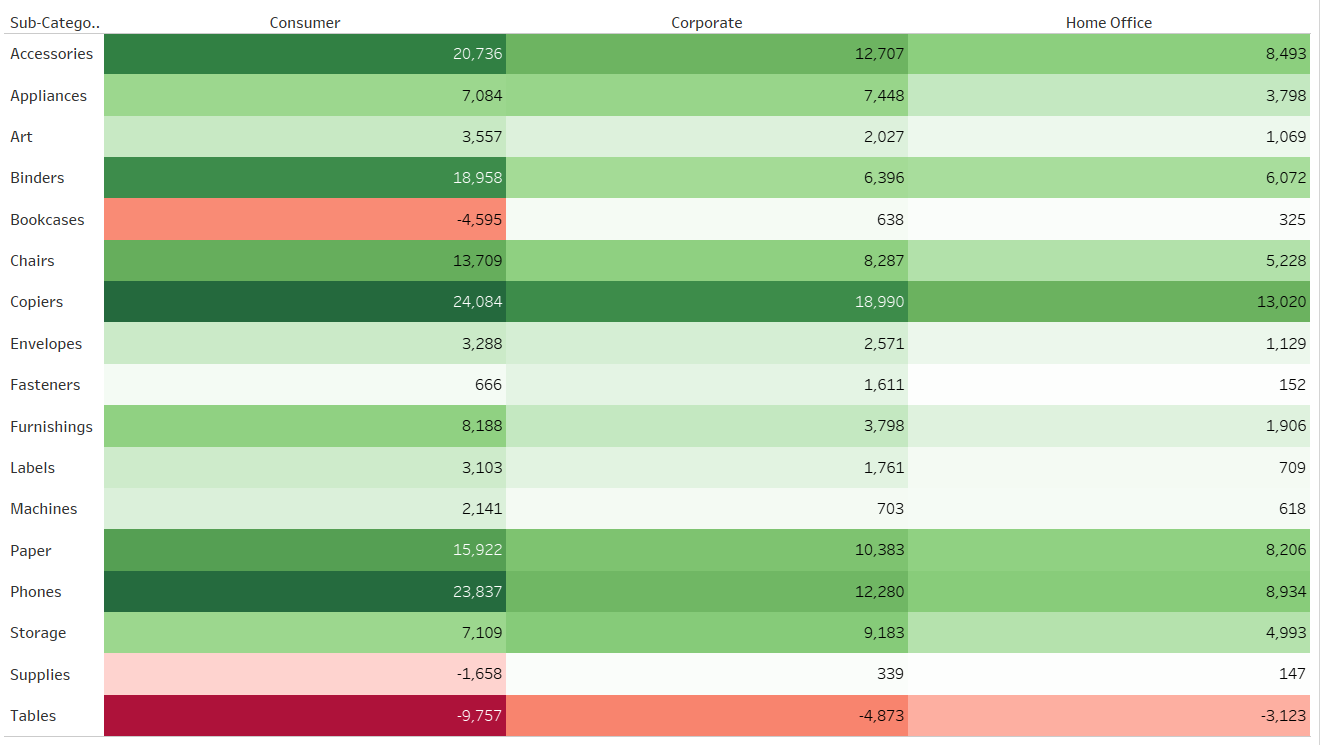
Heat maps/Highlight tables
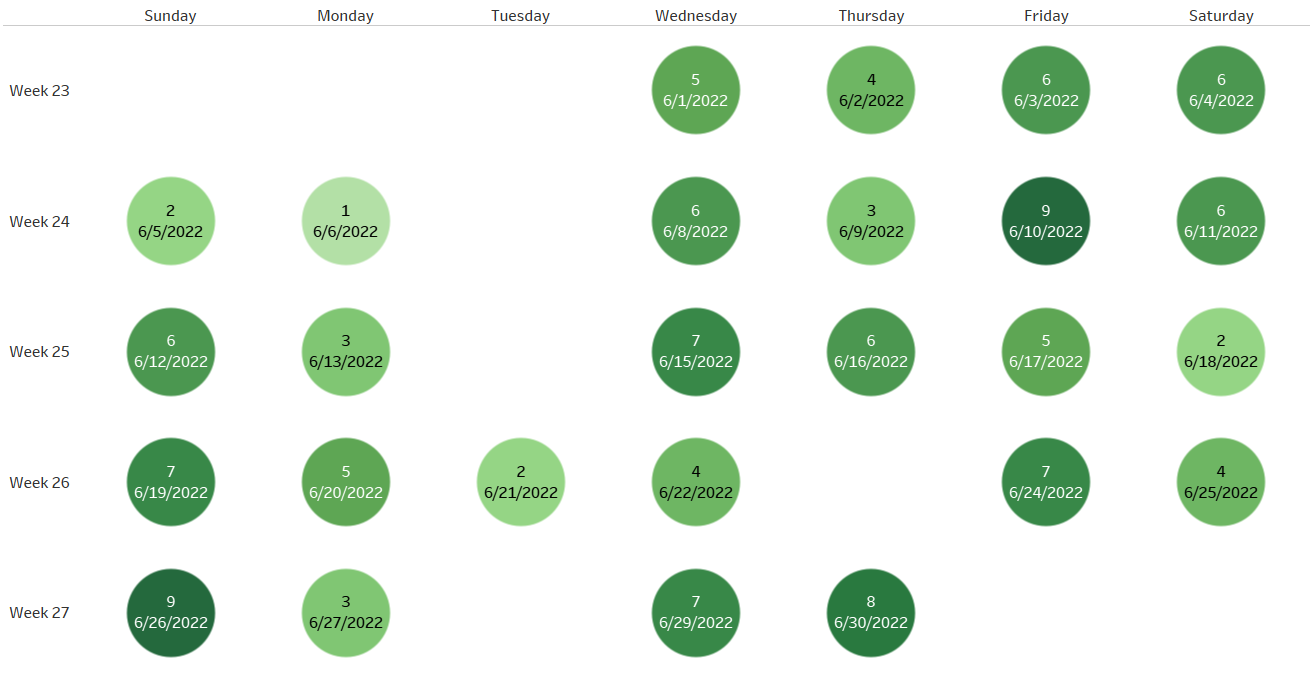
Calendars
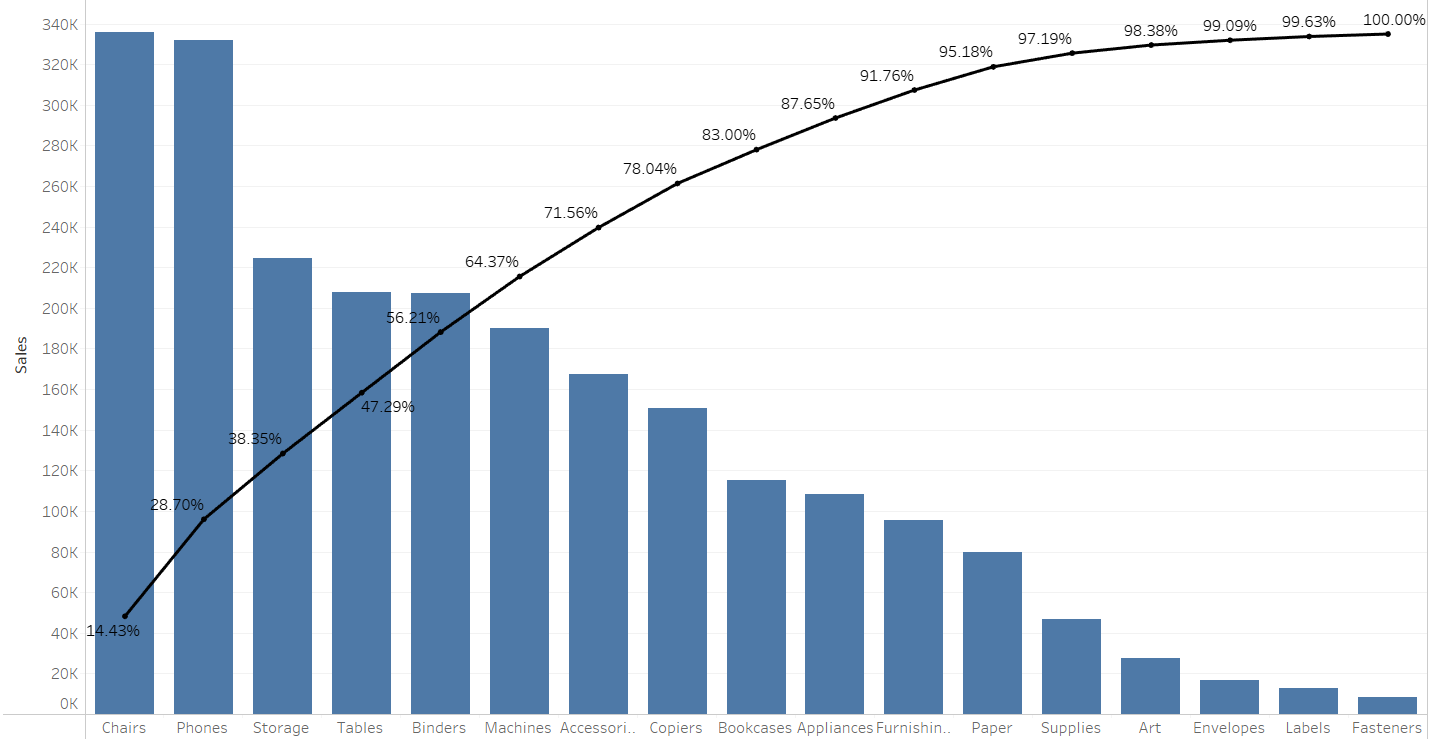
Pareto charts
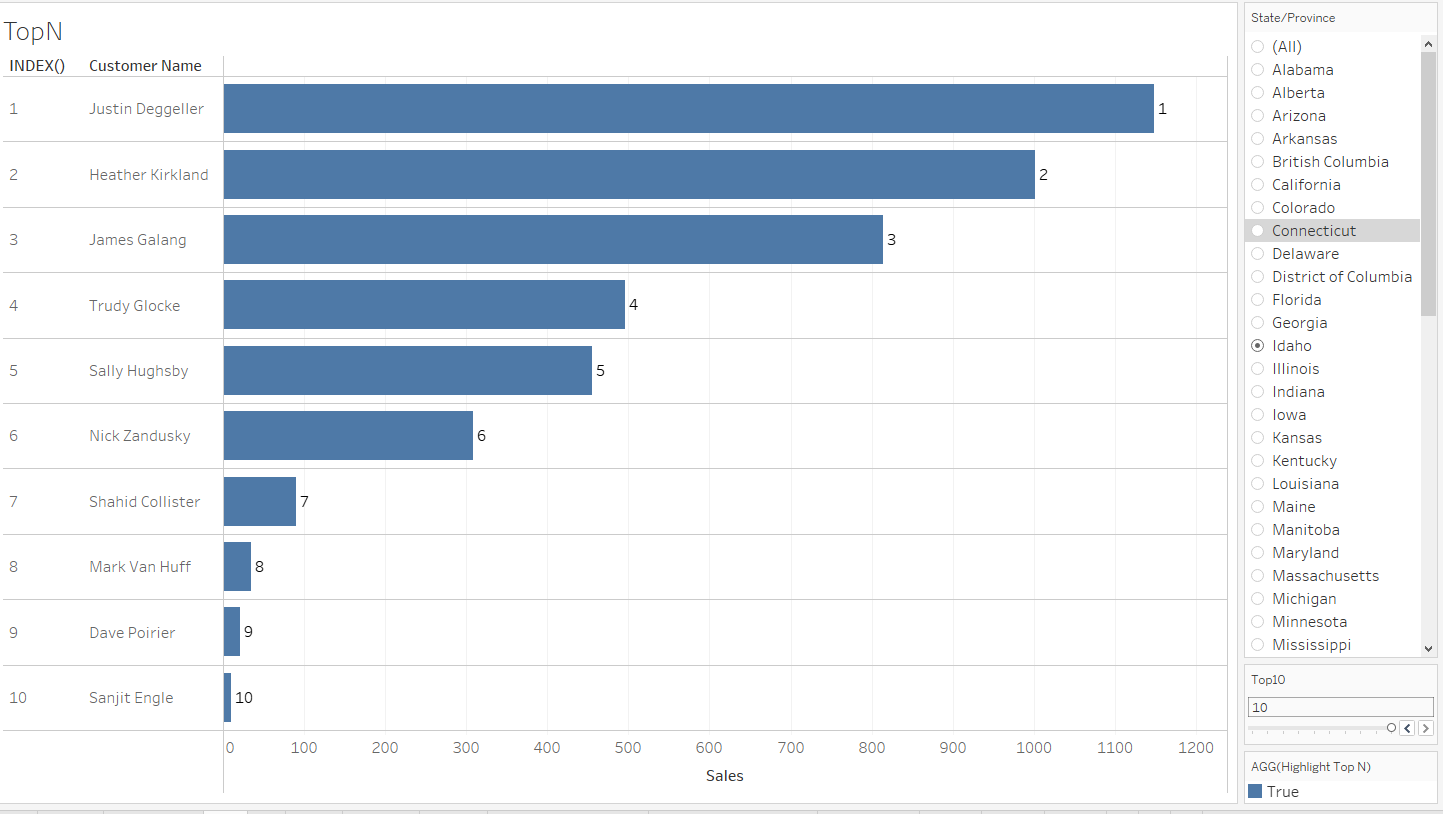
Top N bar charts
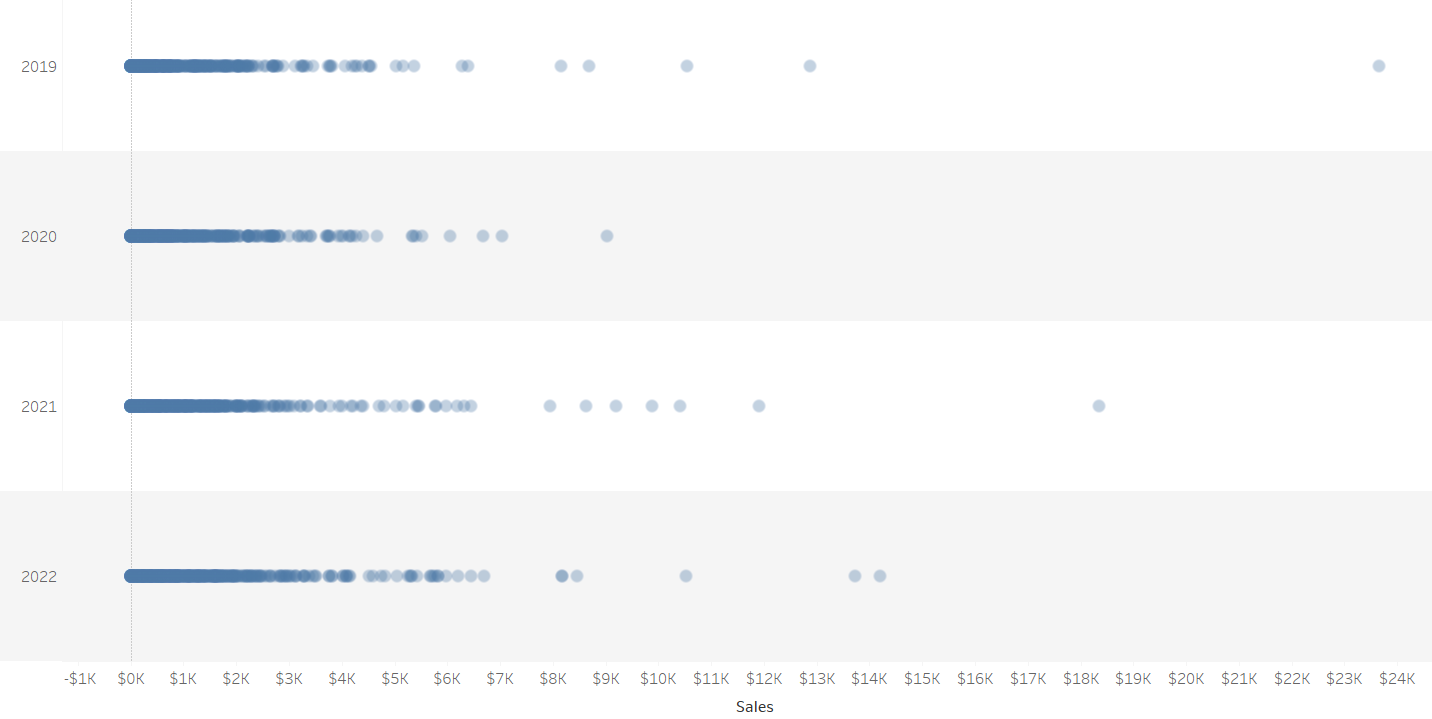
Dot plots
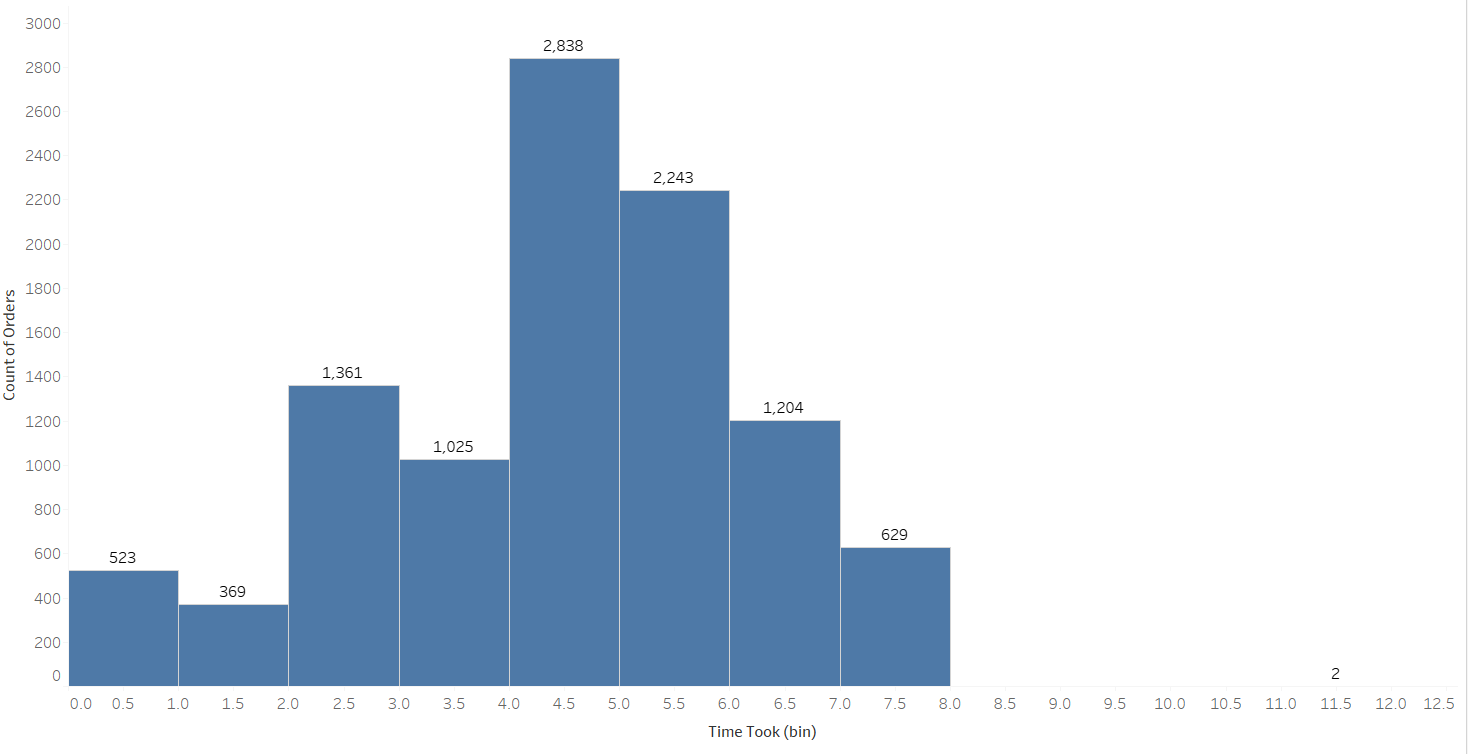
Histograms
Area charts
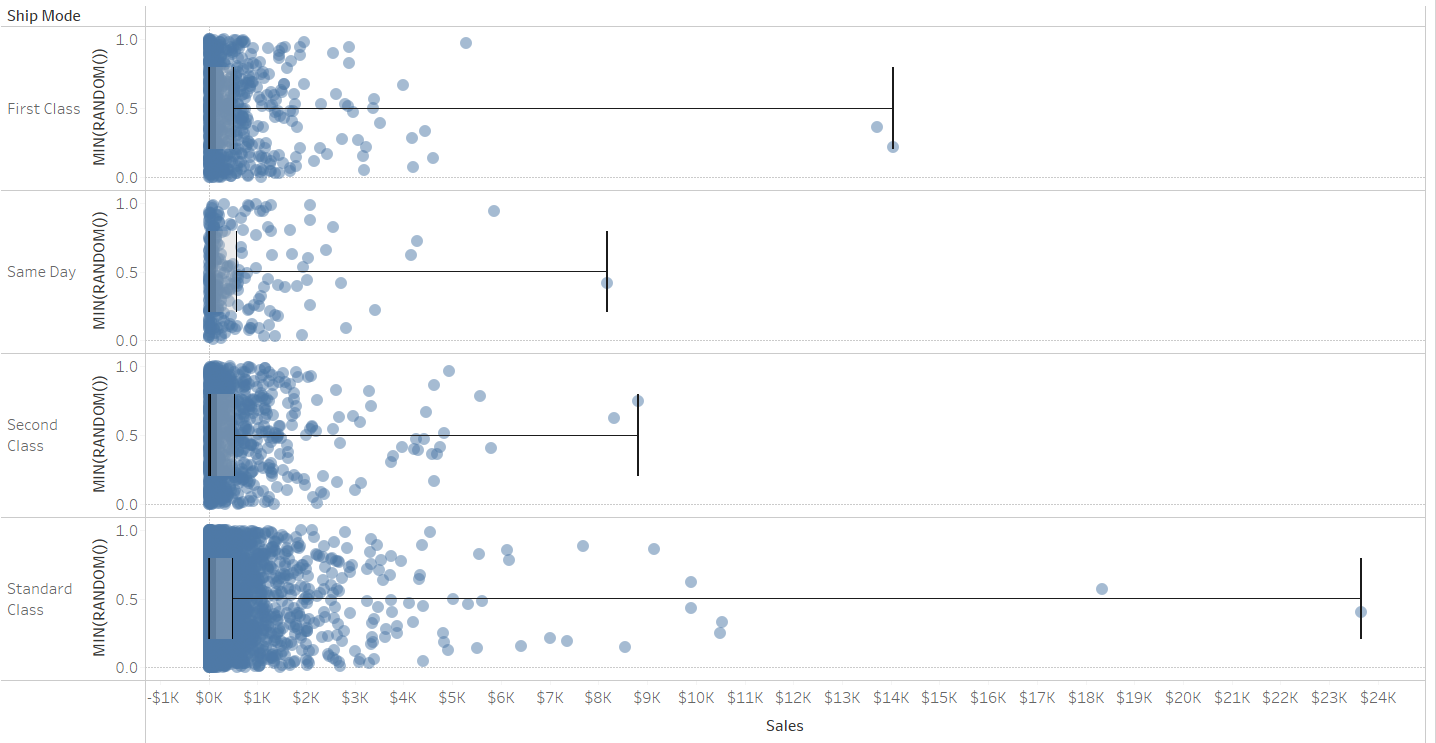
Jitter plots & box and whisker plots
Analytical Concepts:
Level of Detail (LOD) expressions
Trend lines
Average reference lines
Dual axis
Calculated fields
Parameters
Index() function
KPI (key performance indicator)
BAN (big angry numbers)
Table Calculations
% difference
% of total
Running total
Tableau Features:
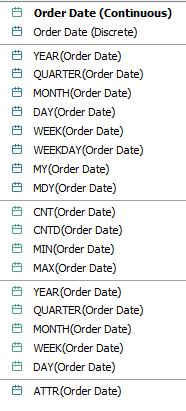
Difference between “blue & green things” (measures vs values & continuous vs discrete)
Difference between date parts and date values
Filters
Marks card
Tooltip customization
Color preferences (sequential, diverging, or categorical)
Parameter settings (apply button, single/multiselect)
Groups, hierarchies, sets
Axis vs Headers
Customizing the axis
Splitting fields by delimiters
Containers on dashboards
And finally, the benefits of naming your worksheets appropriately (I could still use more practice with this)