One of the true joys of Tableau and a feature that really makes it stand out in the data visualization world is Tableau’s interactivity. The latest update has built on this with the introduction of parameter actions. These essentially allow your audience to change a parameter value through direct interaction with marks on the viz – deepening the intuitive nature of Tableau.
So, how does it work? I’ll take you through a simple example and give an example of how it can be used within a viz.
Here’s an example of a parameter action I used in my installment of Makeover Monday this week.
As you can see here, the user I able to click on the heatmap which correlates to a year and a country to change the bar at the bottom of the page. On older versions of Tableau, a user would have to use a dropdown menu or something similar (boring right?!)
Let’s break this down into steps, if you want to follow along download the Superstore data. Note: you must be using Tableau 2019.2 or later to be able to use parameter actions.
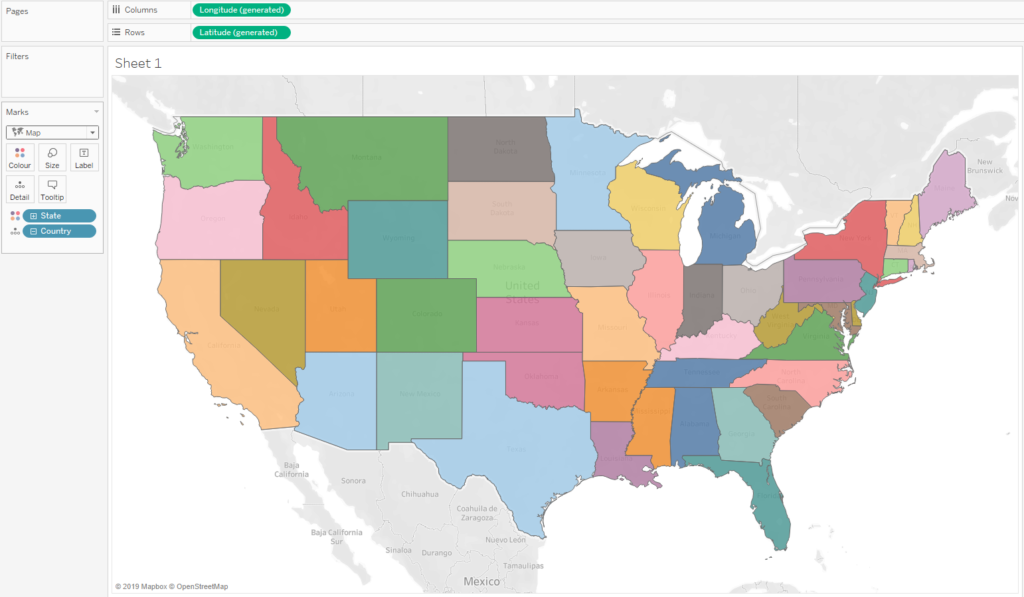
- First make the map: Double click the Country field, drag State onto colour and change the mark type to ‘Maps’
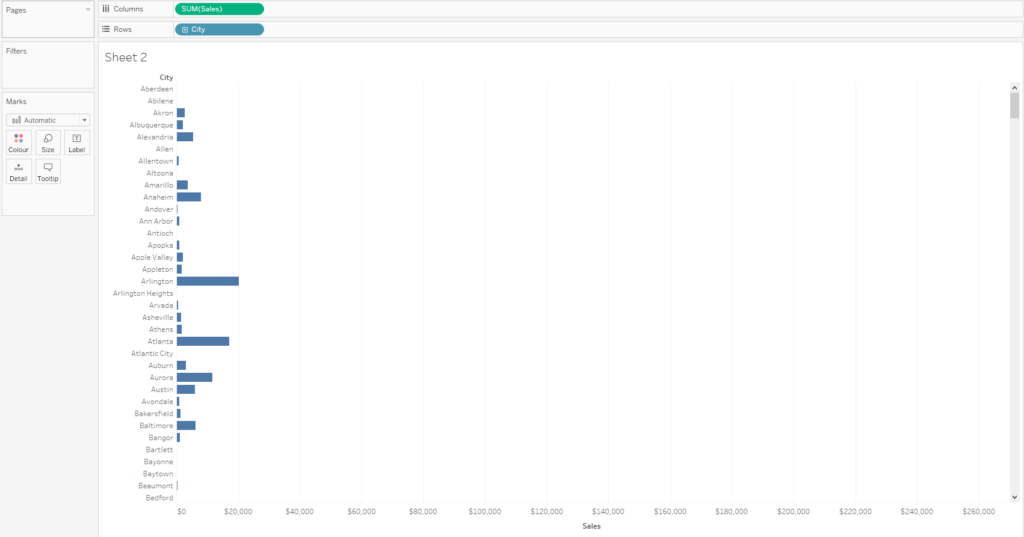
- Next open up a new sheet and create a bar chart with the sales for every city. Drag City onto rows and Sales onto columns.
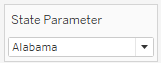
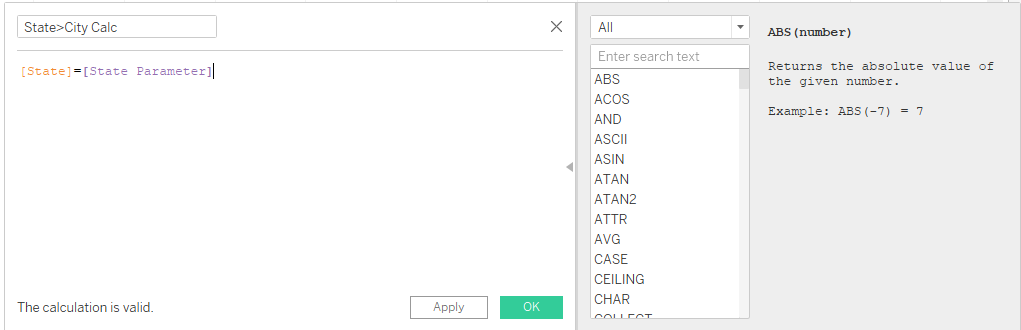
- Cool, so now let’s create a parameter that will essentially lead us to filtering by state. Right click State and ‘create parameter’ – we don’t need to change anything in this window so just hit ok. Right-click the new parameter in the bottom left and ‘show parameter control’. Lastly lets ‘wire up’ our parameter with a calculated field. Create a calculated field, call it ‘State>City Calc’ and type into the box ‘[State]=[State Parameter]’
Lastly drag on this new calc onto the filters shelf, tick true and hit ok.
Now we’ll have a pretty standard parameter that is able to change which cities are in the view based on the state selected.
- Right, now for the exciting part, the parameter action! Create a new dashboard and drag both of your sheets onto the view. Next, go to ‘Dashboard’ in the menu bar at the top of the screen and choose ‘Actions’
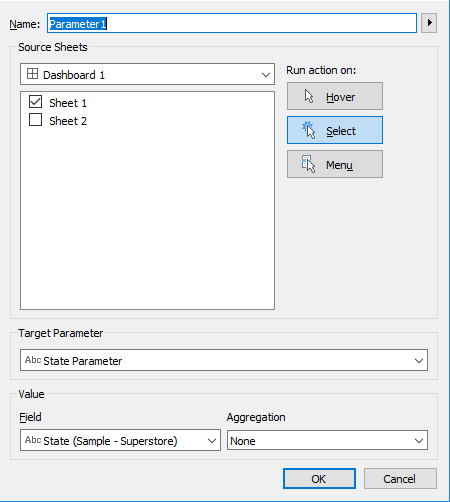
Hit ‘Add Action’, then choose ‘change parameter’. You’ll want the source sheet to be the sheet in which you are causing the changes, in our case the map we created. The Target parameter will be the parameter we are looking to change with our action, so ‘State Parameter’ and the Field should be ‘State’.
There we have it! Click on a state on the map and you’ll see the bar chart changing to only include the states selected – nice job!
Parameter actions open up a world of possibilities when it comes to user interaction so enjoy yet another fun feature Tableau now offers.