So day four is down and the challenge was to use an API call to bring in events near our hometown and create a viz using a visualisation software that wasn’t Tableau.
Ergh, I miss Tableau.
So from my limited knowledge of the products on offer – Power BI, Looker or Qlikview, I knew that all of the calcs and data exploration had to be done in Alteryx, and I would have to have a clear idea of my end result before trying to create it.
The API was really straightforward and the data interesting to look at. The data gave us events within 50 miles of our hometown, along with copious amount of info on them, such as price, location, start times etc.
I thought it would be interesting to try and decide based on my preferences which event would be most suitable for me. My three preferences were price of the the ticket, cost of the journey time by cab to the event from my house and lastly the number of pubs in the immediate area.

The first section of the workflow is fairly standard stuff. I called the API and got back 100 events ranging from tomorrow until 2020, JSON parsed it and did some general cleaning of the data to have one row per event with all of it’s information.
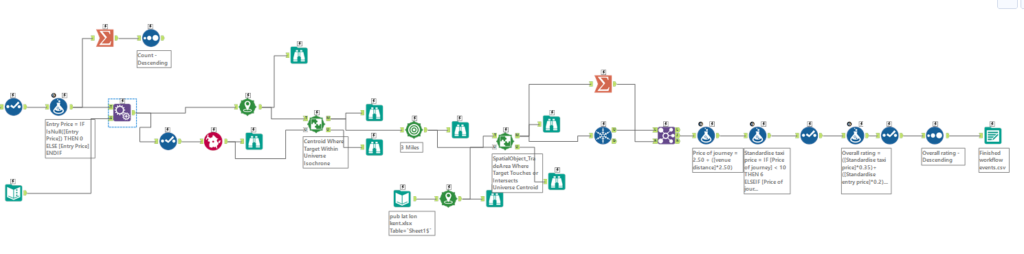
The second part of my workflow is slightly more complicated. First I brought in a macro created by a former DSer which essentially allows you to create a polygon based on drivetime from an origin (my house). I used this macro to create a polygon based on 30 minutes of drivetime from my old house in Canterbury, Kent. I excluded any event outside of this polygon, cutting it down to 30 minutes – an acceptable amount of time to travel to an event in my eyes!
Next I brought in data I found online with addresses of all of the pubs. I first used a converter online to convert postcodes to longitude and latitude, put it into Alteryx and created centroids from these fields.
I created trade areas around each event of 3 miles and then counted how many pubs were within each trade area (event). The highest number of pubs near the event was six, and this formed the basis of my standardisation of the three metrics I laid out.
I created a formula that estimated journey time to each event. A base fare of £2.50 and £2.50 for each kilometre thereafter, perhaps no the most robust formula, but the same for each event.
From here I standardised the three metrics. Essentially I binned the price of the journey and price of the ticket ie: £0-10 is a rating of 6, £10-20 is a rating of 5, £20-£30 is a rating of 4 and so on…
For each metric I had a rating between 1-6. Next I weighted these on my preferences, seeing pubs within 3 miles as most important at 45% weighting, cost of the journey to the event as next important at 35% and the event ticket as least important at 25%. The formula was essentially – (price of journey * 0.35) + (price of ticket * 0.25) + (number of pubs within 3 miles * 0.45)
This gave me an overall rating for each event, and allowed me to see which was the most preferable event for me.
Next, I had to visualise it. Armed with Tableau I believe I could have created a really great viz with lots of interactivity – even changing the metrics/weightings for the user’s own preferences. Unfortunately with around an hour left I struggled to pick up Power BI quickly and am disappointed with my final viz.
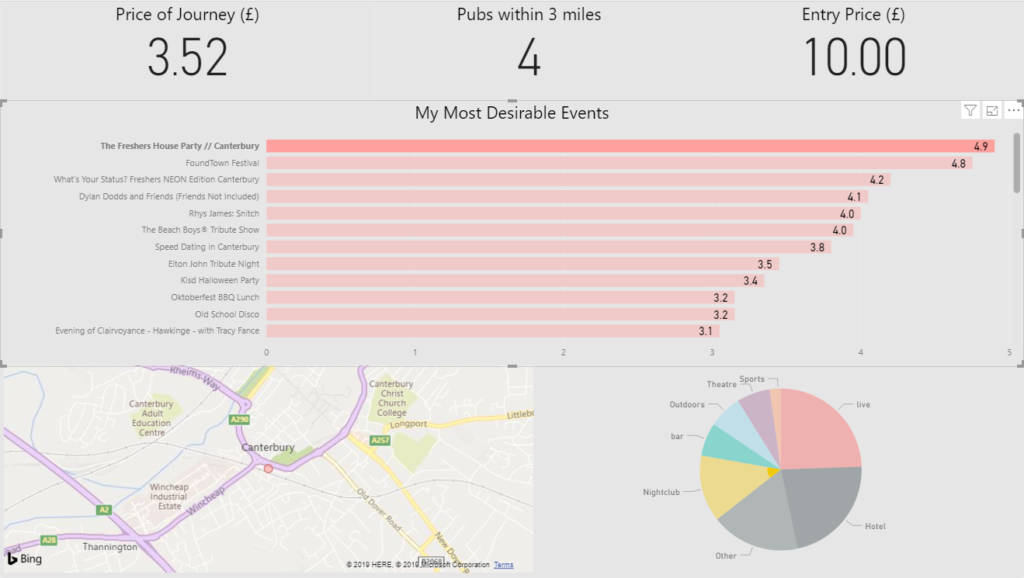
There you have it – a viz I’d have loved a lot more time with.
Also it’s slightly worrying my most desirable event is a University Fresher event, will I ever grow up?