I missed my bus. I thought it left Victoria Coach Station at 1845 on Friday evening, turns out it was 1830. I got there at 1831 after detouring through the meal deal section at the Sainsbury’s Local across the road. The ticket attendant squawks ”We don’t have no more buses to Cheltenham until 2200” which equals mad dash to the underground to get to Paddington and get through the barriers without a ticket (somehow) and sit in a 50cm squared spot outside the lavvy with some eccentrics bag and jacket leaning on my shoulder.
In short, my brain is frazzled!
What a fantastic week. To walk in thinking that I knew a bit of Tableau having used it for a short period of time before starting and getting ready to build on top of that; to being taken back to square one, correcting bad habits and learning a lot of the theory behind it all, incredible!
So what led to my missing of the bus, the said head-frazzling and lavvy seat while listening to Nothing But Thieves’ new album hoping the conductor doesn’t come wandering along? Read on my friend and your questions will be answered:
Day 1
Very much an introduction day, a welcome from Tom Brown (CEO) and getting all things tech-y set up. We then got an intro to Zen Master and Head Coach of the Data School, Andy Kriebel and his Tableau journey. Finally in the last hours of the day we got to do some work on Tableau with this weeks Makeover Monday and present it back to the other DSers.
Day 2
The first hour of the day was given to James Elioart, Senior Vice President of EMEA at Tableau (a pretty important guy would be an understatement) who gave us a talk on the origins of Tableau and what the future holds. It was very humbling for him to give us his time and was greatly appreciated.
Then Andy ran a session on the principals of data viz looking at how to leverage different aspects of charts to have the user read your story the way you intend it to be read. Then we cracked on with some Tableau 1-o-1 (que eccentric man’s laptop bag falling off of his bag and onto my head).
Day 3
The hardest challenge that we would face this week was set to us on day 3, ReVizzing one of the two vizzes that we created for our application. I have never done this before, and after pouring hours into creating something, you strongly believe it’s the best thing you can do with the given dataset and there is nothing you can possibly do that will improve it – you are wrong. For any Tableau heads out there, I implore you to give it a try. Take a viz that you have done, critique it (or get someone else to critique it) and do it again. Most of us had just thrown charts into our submissions without really thinking about the flow or how the content worked together and then had to present these on Friday afternoon.
Day 4
For me, hands down best day of the week. We had a very insightful infographic training day with the fantastic Caroline Beavon (@carolinebeavon). We learnt so much, from fast sketching (revolutionary that is by the way) to how to arrange the layout of vizzes. We even learnt some new software outside of the realm of Tableau (BLASPHEMY!!!), Piktochart which is really good for the quick infographic.
Most importantly from this session was to think not only about the aim of your infographic/dashboard, but who your audience is and how are they going to see your output. For example, if you are designing a billboard you cannot have 20 facts up there as most the audience are going to be driving past at 30mph – one quick fact is all they will manage, so is all you can include. If it is something they are going to invest more time into then it is something that you can include more detail in.
Day 5
F-F-F-Friday! What better way is there to kick off a Friday morning than with a joins and blending session with Nisa, a fellow DS alumni. The intricacies of this are intriguing and certainly not for the faint of heart (probably a whole other blog post that I will not be qualified to write for another year).
Then straight back into Tableau 1-o-1 with Andy as he hit us with some mind blowing table calculations (a lot more to these bad boys than meets the eye) and even looking at pie charts where Andy went a bit McCandless on us and let his artistic spirit take over (a sight no-one want to see).
Finally to wrap up the day we polished off our ReVizzes and presented them to the group and others from The Information Lab contingent who gave up there time to log in, watch and provide some feedback – very much appreciated (Go team!).
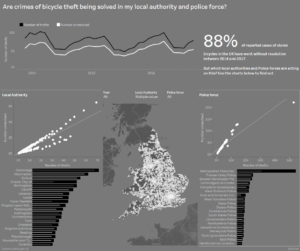
My original is here
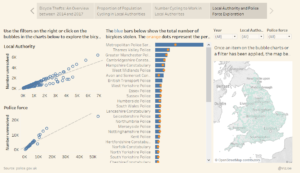
And my ReViz is here
So with week one done, on to next week where several golden nuggets await including parameters and Tableau Server training. Having learnt so much in only one week the want to learn more only gets stronger and stronger and I’m already looking forward to walking through the doors on Monday morning.
If you are thinking about applying to the data school please see my other blog Day one and Done for more info on the application process. If you have any queries please do not hesitate to contact me through my twitter page (@DriveMyData).