In Tableau, table calculations are a quick and easy way to manipulate data in the view to gain insights and also organise the data. The INDEX function is one example of the latter.
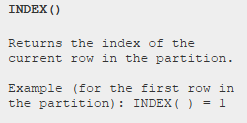
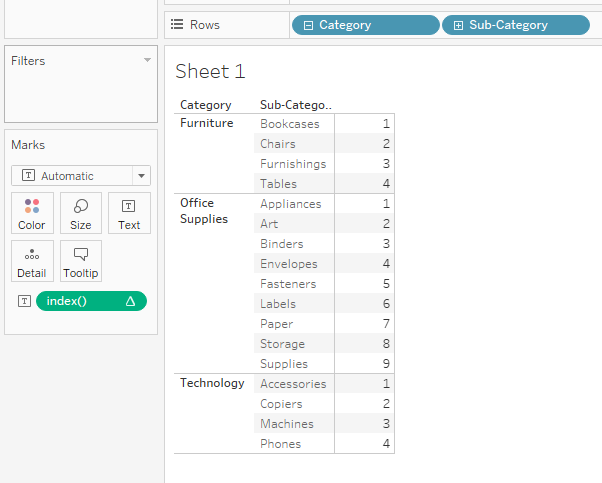
Essentially, INDEX() ranks each row. Crucially, as it is a table calc, the ranking can be restarted in different ways by specifying the partitioning fields (i.e. the dimensions in the view which determine how the data is broken up for each calculation). See the example below (which uses the Superstore sample data in Tableau):
We can recreate this function in Alteryx using the Multi-Row Formula tool. This tool allows users to create a new calculated field by using specific values from different rows.

So in the tool, all that is needed is a simple formula which references the rank from the previous row. However, as the first row references a row which doesn’t exist, which is specified to equal 0, 1 must be added on top of the previous row value so the index starts at 1 and subsequently can increase.
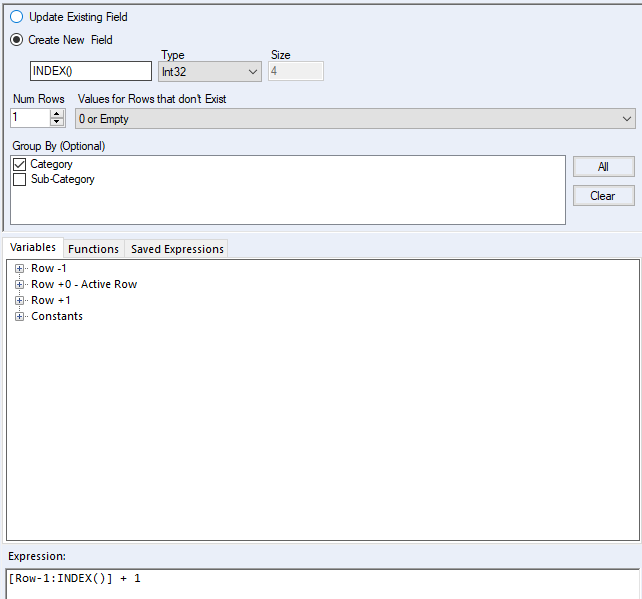
Lastly, the key feature which allows flexibility in the formula is the set of Group By tick boxes. This determine how the index calculations are grouped within the data. So in effect the way the data is divided into groups to count through separately. In the original example, the ranking restarts at every major Category, so in Alteryx the Group By must be ticked for Category.
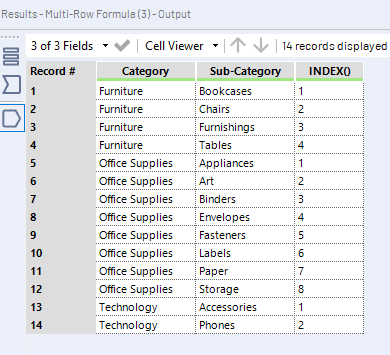
The end result is the same as that in Tableau: