Today we were tasked to download data from Harvard Dataverse on electricity in India. The data was survey based (again). Respondents were asked about their energy source, their perceptions to energy use as well as background such as employment and where they lived. The challenge consisted of downloading the raw data and then parsing a pdf which indexed all the questions. The pdf could be used as column headers or to fill in as lookup tables for questions where answers were recorded as a-e (for example) representing 5 different employment types.
Getting the data:
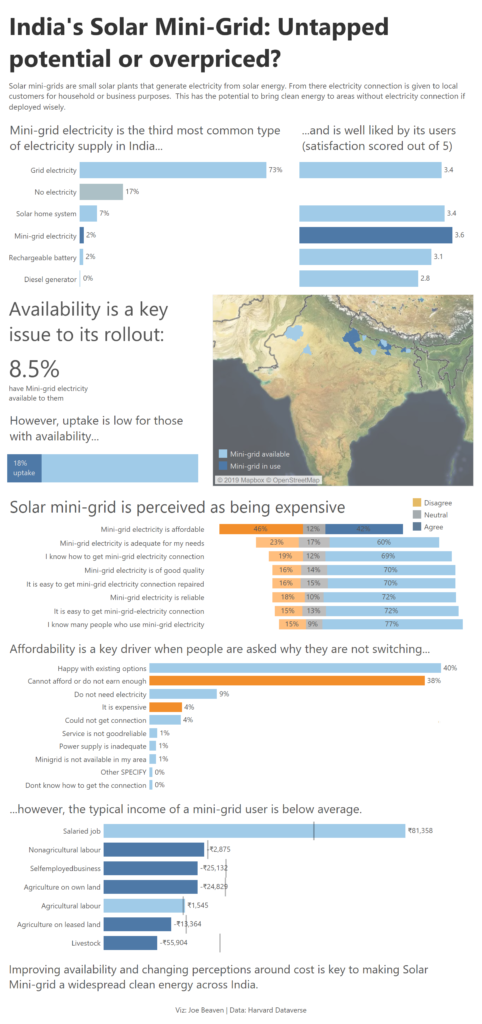
Given the data consisted of 561 columns initially, I decided to pick out a story early to narrow the scope of the data prep challenge. As a few questions focused on India’s Solar Mini-grid, I chose to focus on this. The Solar Mini-grid uses locally generated solar energy and could provide clean energy in remote locations in India.
With my list of relevant questions, I went into the data and extracted all the simple fields such as salary, one column, one numeric response.
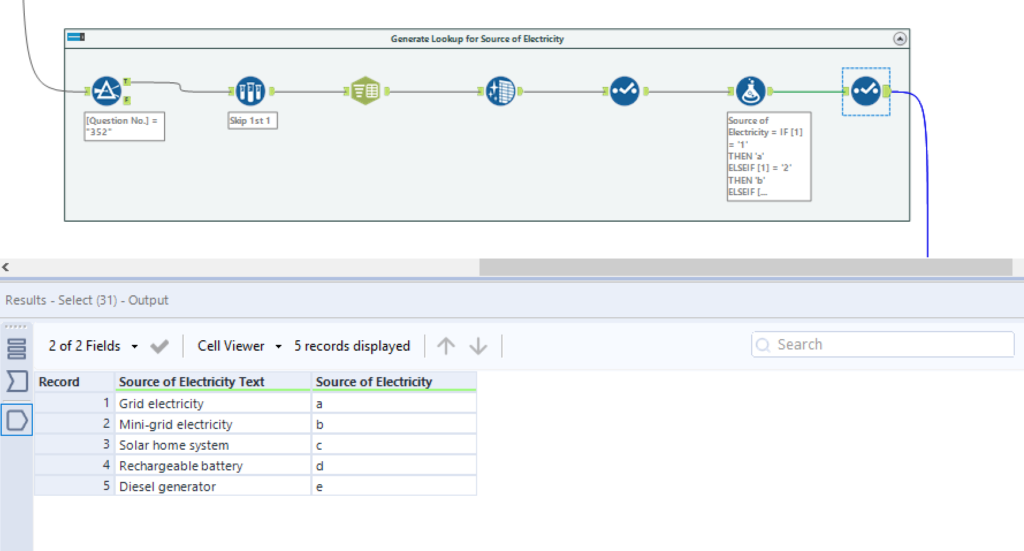
The second task was to reference any coded answers from a table. For example Source of Electricity was recorded a-e with (a) being ‘Grid Electricity’ and so on. To do this I parsed the questionnaire index pdf, pulling out one row per question. I filtered into each question and generated a lookup table that could be linked back to my output table for both Source of Electricity and Source of Income. I also took a similar approach to generate a lookup for a question that asked why people would not want to connect to the Mini-grid.
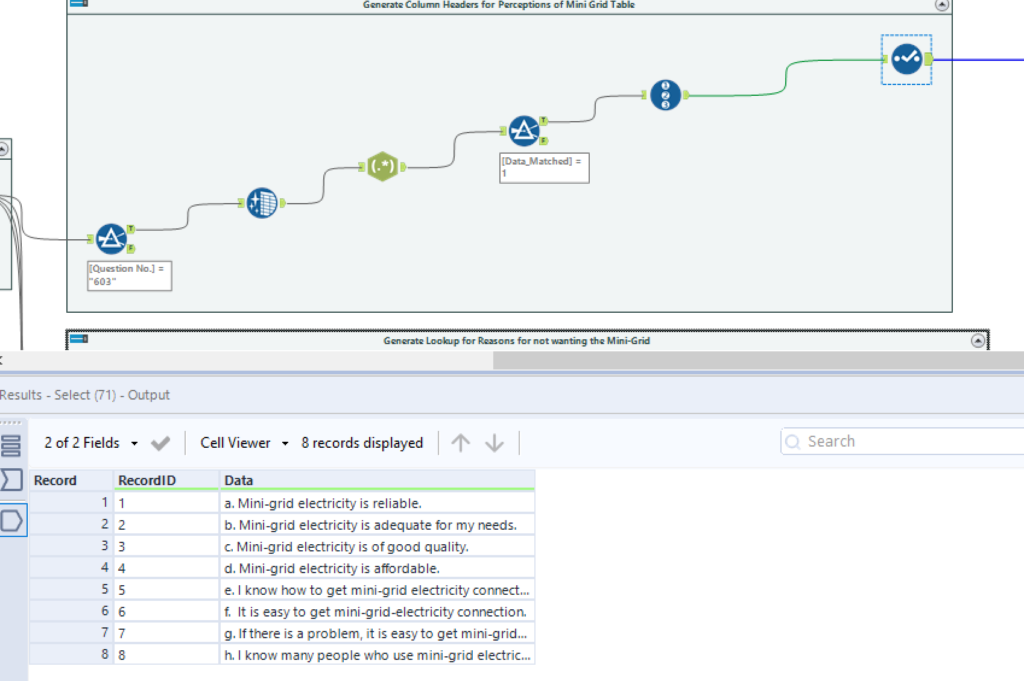
One survey asked for people’s perceptions of Solar Mini-grid electricity. The column headers did not explain the question being asked:

However the question asked was recorded in the Index pdf. So I generated another a lookup table this time for column headers rather than cells.
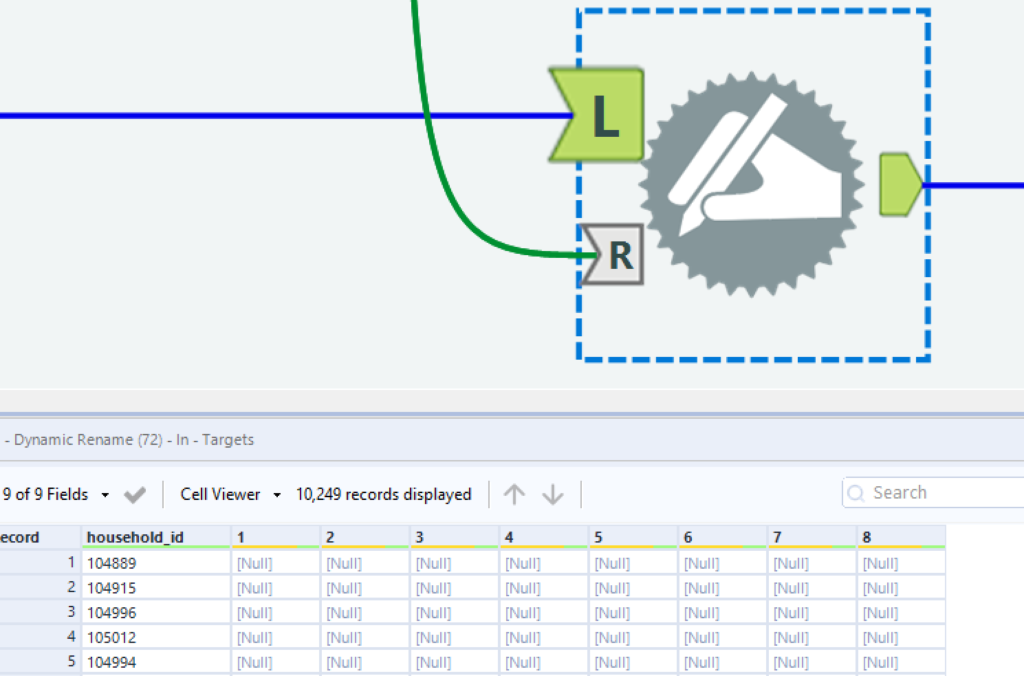
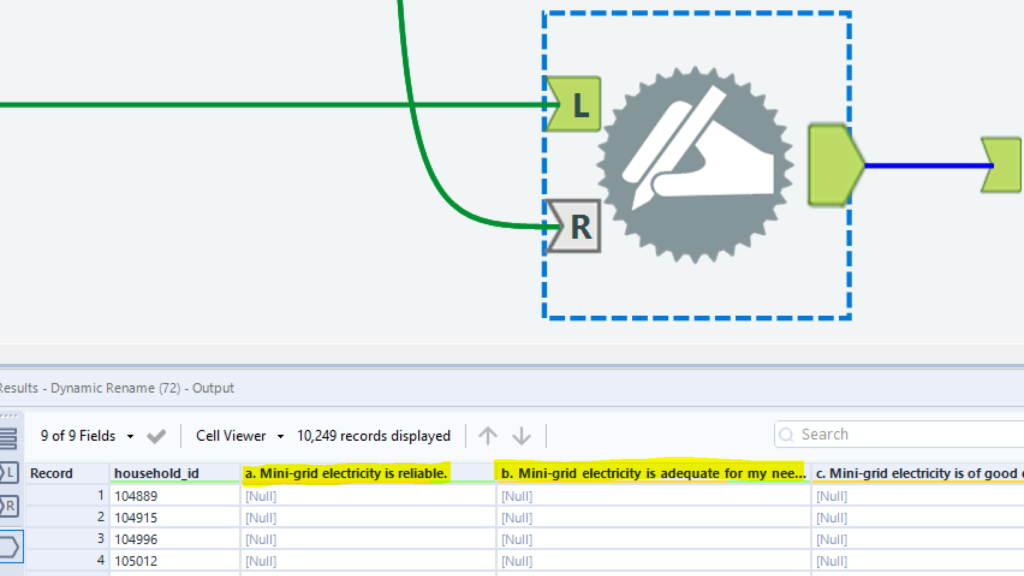
Making use of Alteryx’s Dynamic Rename tool to get the headers accurate:
The Dashboard:
Bringing together my data in Tableau allowed me to explore India’s Solar Mini-grid. I built my first ‘scrolly-telling’ dash. An explanatory style of viz where the read scrolls down seeing different charts that (hopefully) follow a narrative.
My biggest challenge this week was building a Likert Scale scart:
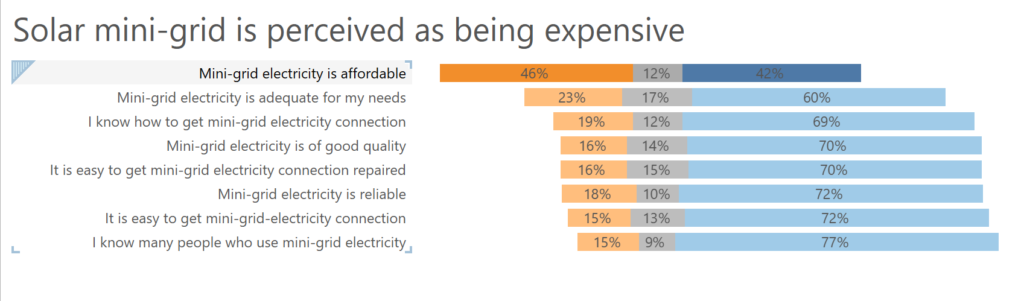
These centre the neutral response (in grey) and hang other responses alongside to give an idea of the spread of responses (i.e. a clear skew to negative responses for my first question above).
To do this I followed a great tutorial from Steve Wexler which can be found here – its great!!: https://www.datarevelations.com/likert-scales-the-final-word.html
Hope you like it – See you tomorrow!