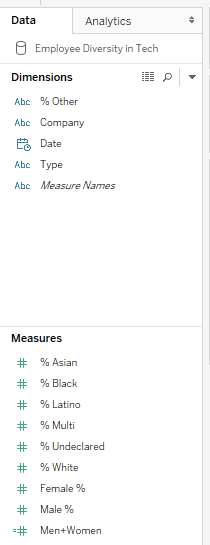
Ever had a data source where each column is showing a similar metric that you would like the user to be able to switch between? I faced this revisiting an early Makeover Monday on diversity in US tech companies for my first weekly project at the DS. The data had a separate column for each race giving measures for each race in Tableau:
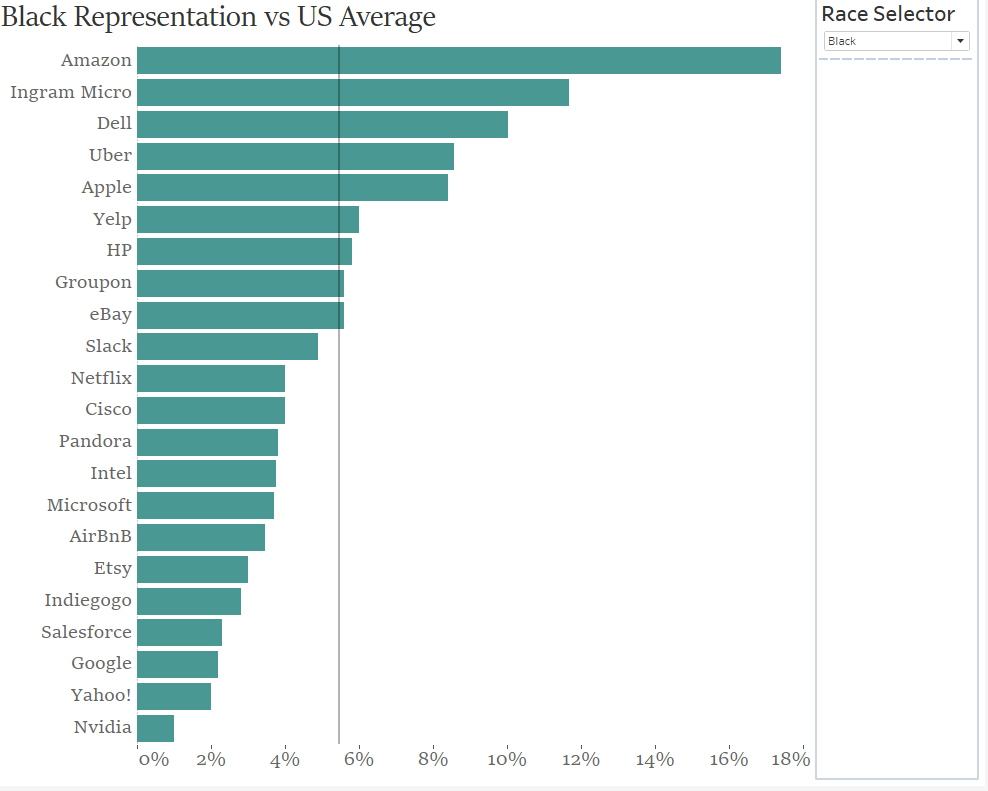
I required a parameter that would allow the user to select which race they wanted to view. Therefore, the measure on the view needed to change dynamically:
To set this up I used the following procedure:
1) Set up the following parameter
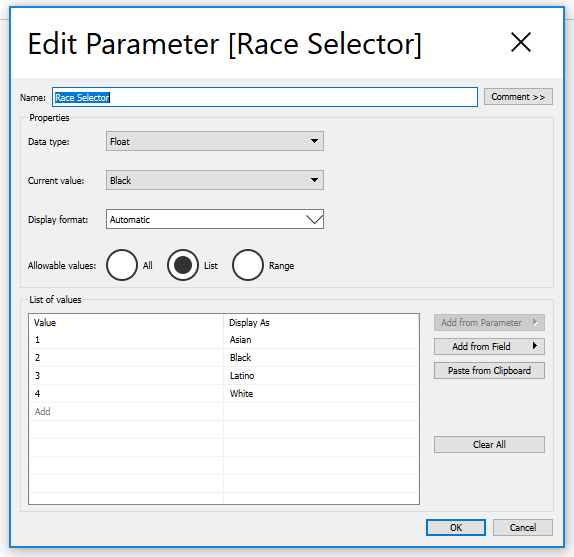
Parameters are defined lists or ranges independent of the data – basically just dials that a user can operate. They need ‘joining up’ to the data in some way…
2) Create an IF statement
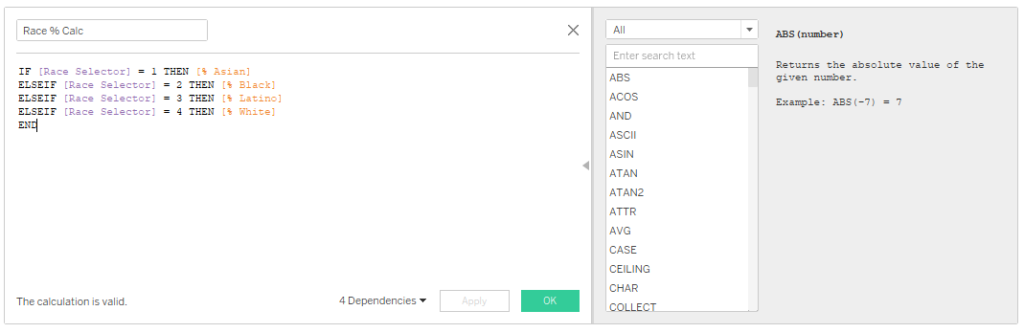
This formula is saying, for example, ‘if the user selects to view proportion of Black employees using the parameter, then this calculated field equals the [% Black] Measure’
3) Build the view
Right click on the parameter and select ‘Show Parameter Control’
Then drag your IF formula to the columns shelf.
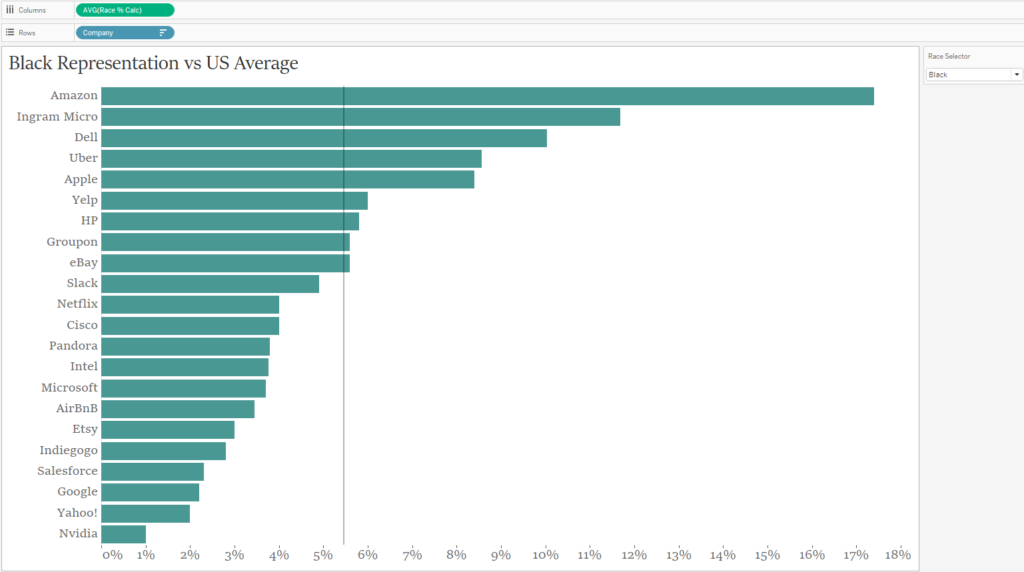
The Parameter dropdown now controls the IF formula. The formula returns the measure you want because the parameter is applied to the formula.
(Also, when writing out the title in the dashboard, click Insert and select the parameter to get a dynamic title!)