


Today is the first day of the dashboarding week in our training. We are given a dataset from Open Data portal from the city of New Orleans. The dataset contains the metadata related to body worn camera videos recorded by the New Orleans Police Department. It is a relatively large data set with a data volume of about 1.7 GB.
I attempted to perform spatial analysis in Alteryx by combining another dataset, Calls for Service 2014 from the open data portal. I wanted to find out if the places where crimes are reported are visited by the police officers carrying the camera or how far it is those reported crimes from the body camera location.
First, I combine the body camera dataset with the geometry dataset for each district
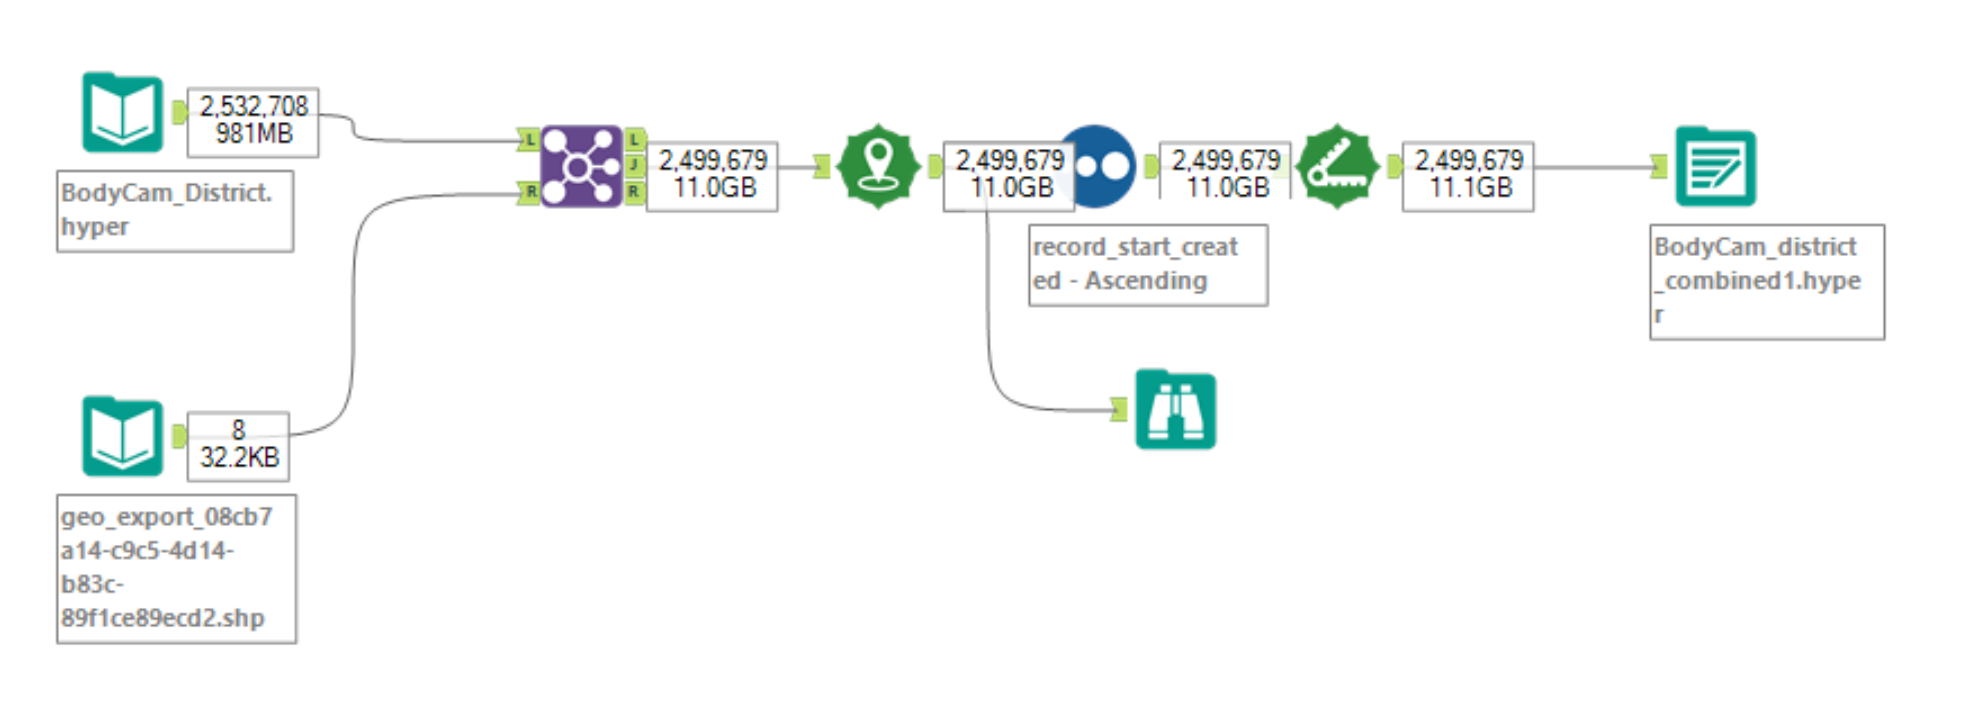
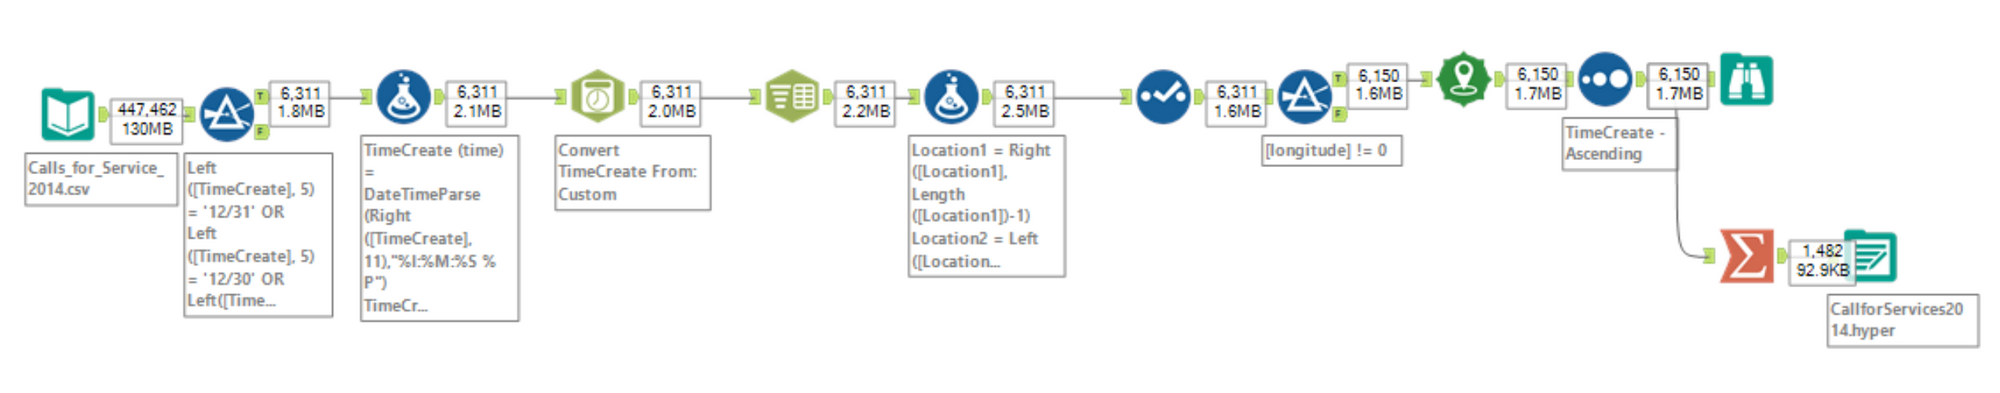
I create points for each of the location where the body cameras are recorded and then I join the geometry dataset by district field. Since the amount of data is too large for my laptop, I ended up having to truncate the data to the last 7 days in 2014. My plan to perform spatial analysis with the given amount of time didn't work out so I ended up having two separate datasets to build my dashboard in Tableau. The second workflow I have in Alteryx to create the bar chart for the type of crime type in each police district in New Orleans is as follows:
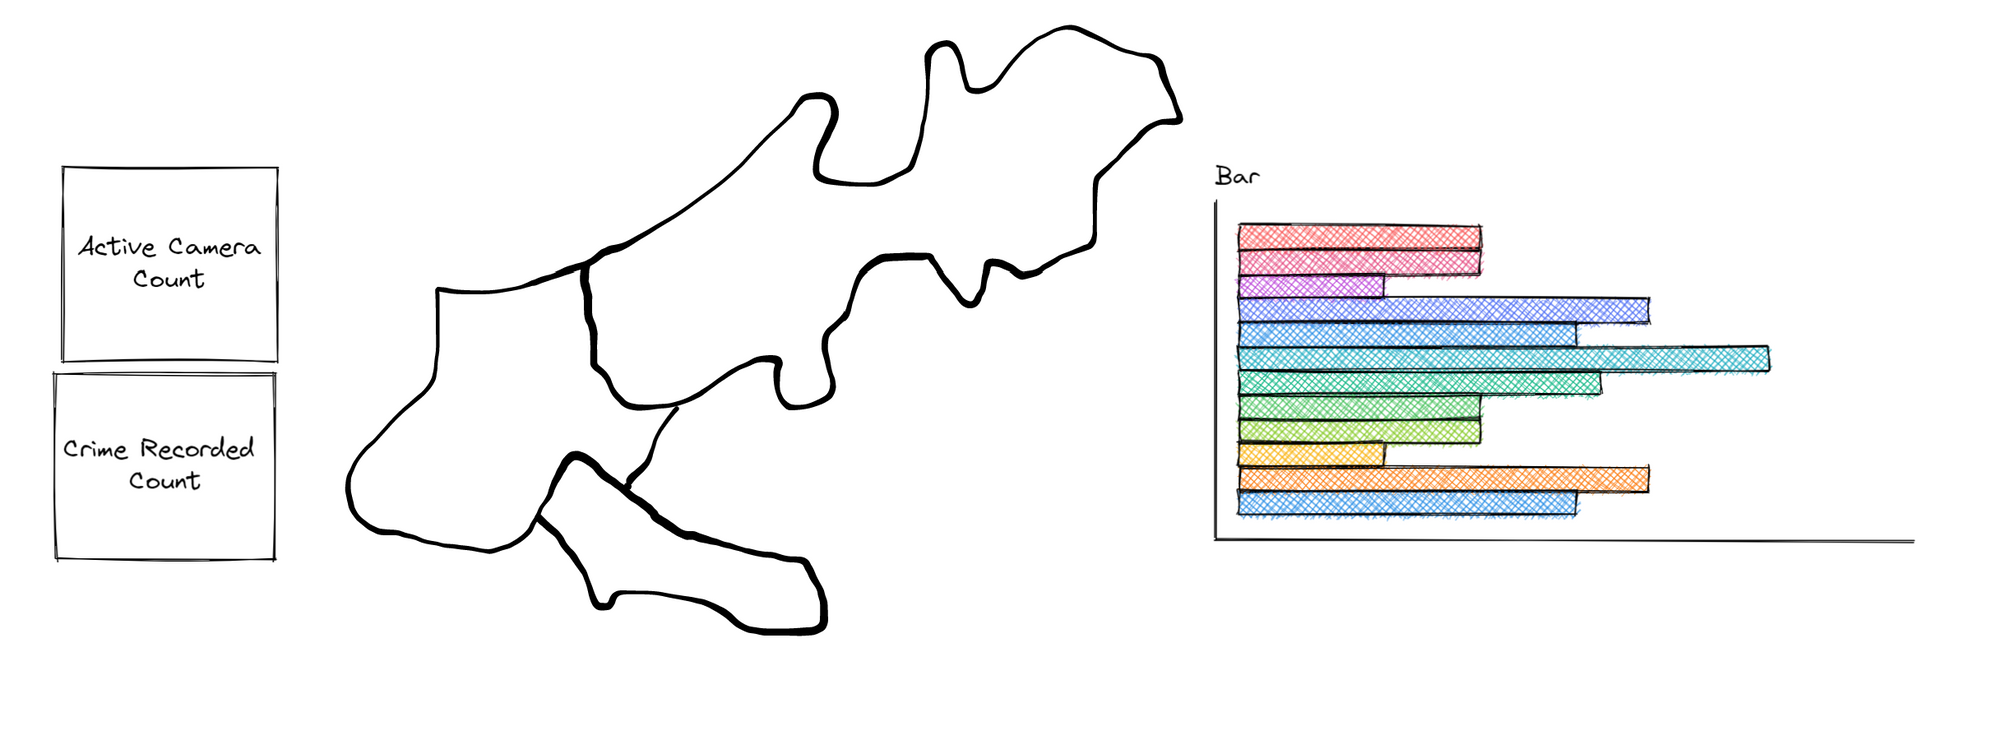
The initial sketch that I have in mind:
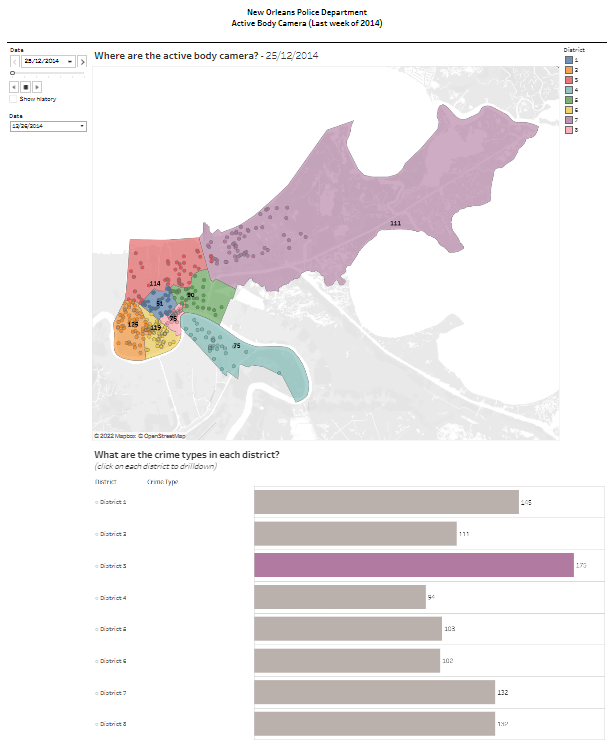
This is the dashboard I managed to build in the end after facing multiple challenges:
That's how my first day of dashboarding week ends! I'll need to remember the next day to start small and not be too ambitious, because having enough is really a luxury with these exercises!