Ever wanted to create a chart where you wanted the x axis to be displayed across the top of the chart instead of the default bottom like this?

If so, you would’ve thought it would be simple, something like right clicking on the axis and selecting an option which will switch the x axis to the top. Unfortunately, there isn’t (there should be!). So this blog will unveil a simple trick which will do this.
Step 1.
Using superstore data, create this chart
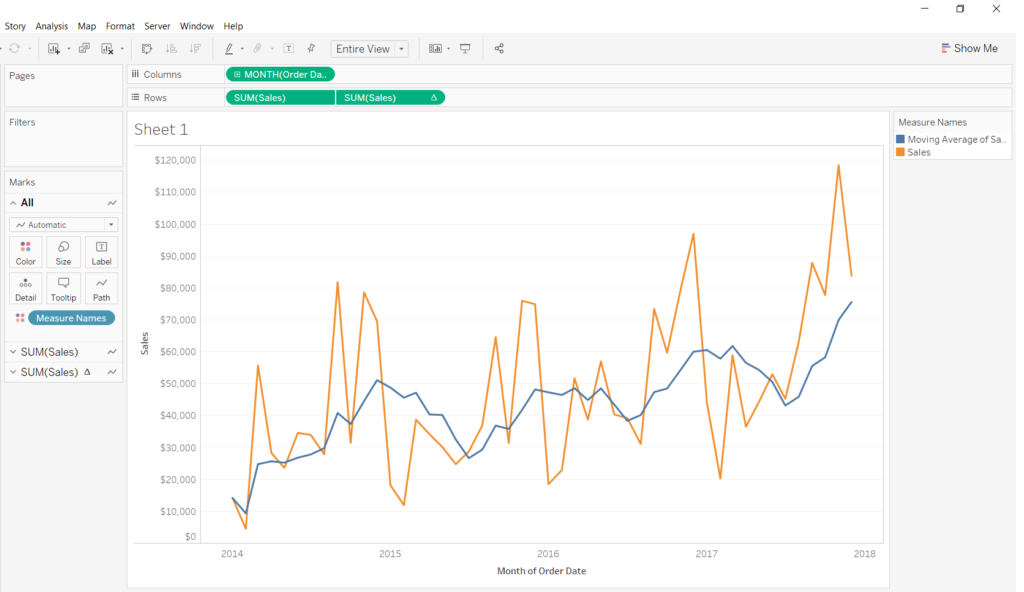
And then drag the continuous ‘Month’ pill to the columns shelf then allow ‘dual axis’ on the two green month pills
Step 2
Next, right click on the bottom axis and select ‘Edit axis’. This should give you a screen like this:
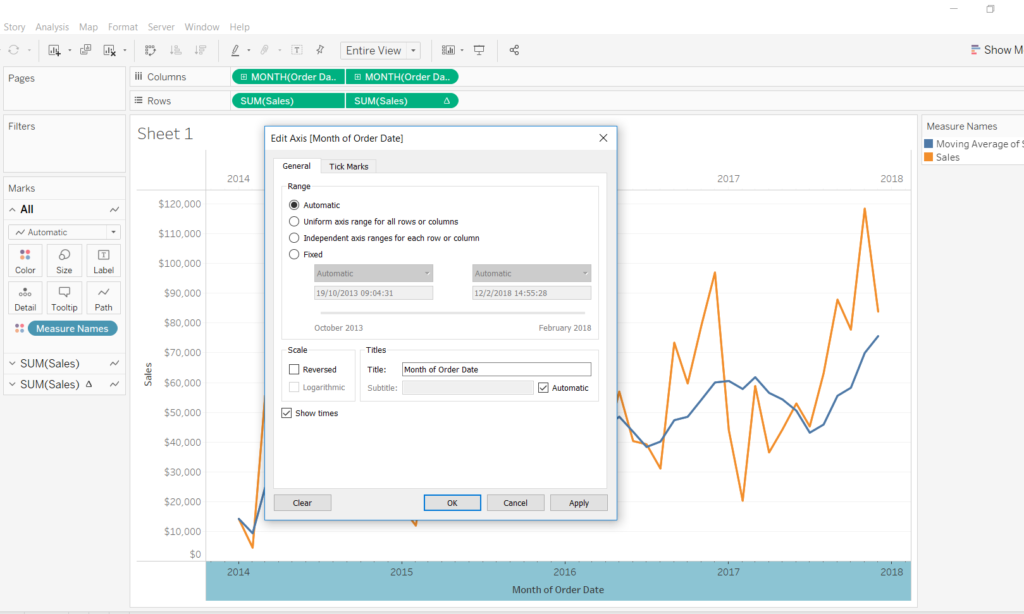
Erase the text in the ‘Title’ box. Then navigate to the ‘Tick Marks’ tab at the top and select ‘none’ on both Major and Minor tick marks. Finally hit OK.
And there you have it, a simple trick which does the job! If you have any questions or anything you want to share with me contact me on twitter or Linkedin. Here is a GIF which combines the steps above, just in case you missed something: