


Day 1 of Dashboard Week we got our data from We got out data from https://www.gov.uk/government/publications/salmonid-and-freshwater-fisheries-statistics-2019/salmonid-and-fisheries-statistics-for-england-and-wales-2019 and it was on salmon and trout fishing in England and Wales. The data was centred around primary two type of fishing: net and rod.
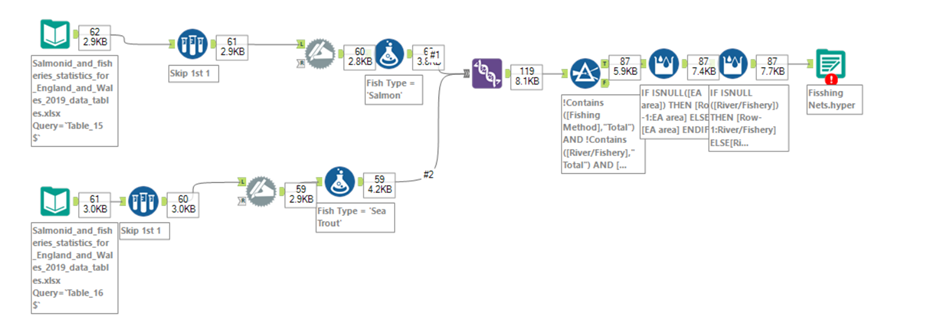
The following two images are the workflows I created to generate two datasets to input into tableau.
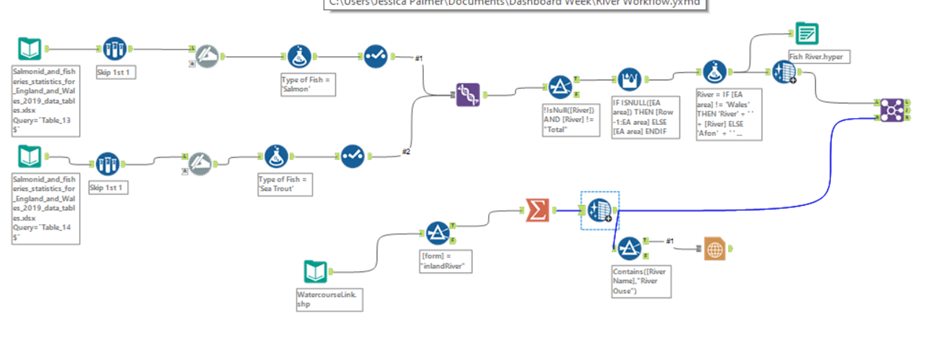
For the rod dataset I attempted to add spatial data for each river. Due to time constraints I was unable to complete this but I got the majority of the rivers to match up to their correct spatial data.
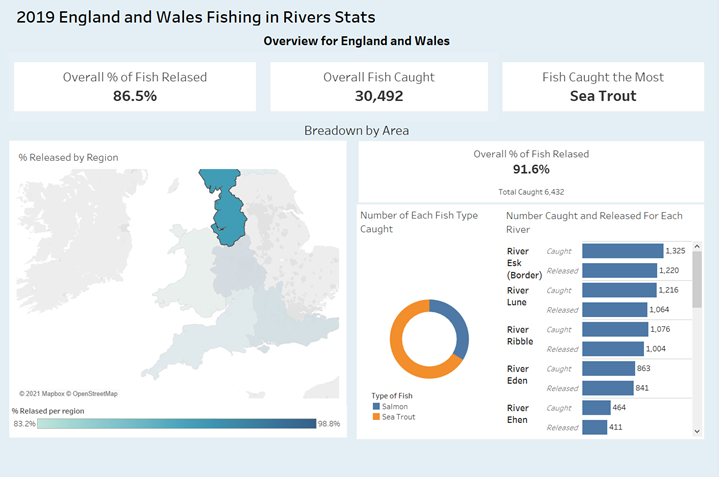
Once these datasets were created I input them into Tableau and created the following Dashboard.
My biggest challenges from this day was understanding the data is such as short amount of time and generating a key question that could be answered in the time. I did not really come up with a key question which is why the dashboard is more of a summary dashboard. This is something I wish to work on in the future and I want to become more decisive with deciding what to do with the dataset in the future.