Today we were looking at the history of powerlifting and we had free rein of which tools we wanted to use! Read more in Andy’s blog. This is probably the dataset that I’ve found most difficult to work with, as it’s not one that I’m familiar with at all! So I spent the majority of my time exploring/discarding various ideas.
In summary, I related strongly to the following creative process today:
Sketch:
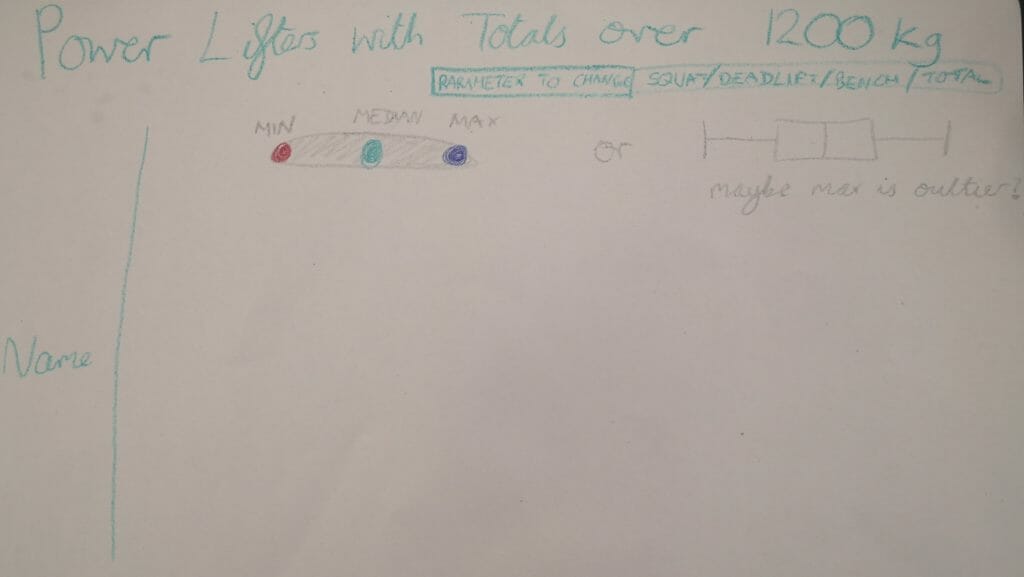
Eventually, I decided to filter the data down to only the best Powerlifters (which I arbitrarily decided meant that they had lifted a total weight of over 1,200kg). This left me with 40 people who I assume are serious about weightlifting.
I then wanted to investigate the range of their performance across different competitions. Were they always on top form? Did they come from the bottom and work their way up? Was making it into the ≥1,200kg club just a fluke?
Viz:
At the sketching stage I wasn’t sure what chart would answer these questions most effectively. I played around with a lot of different charts but eventually settled on the following:
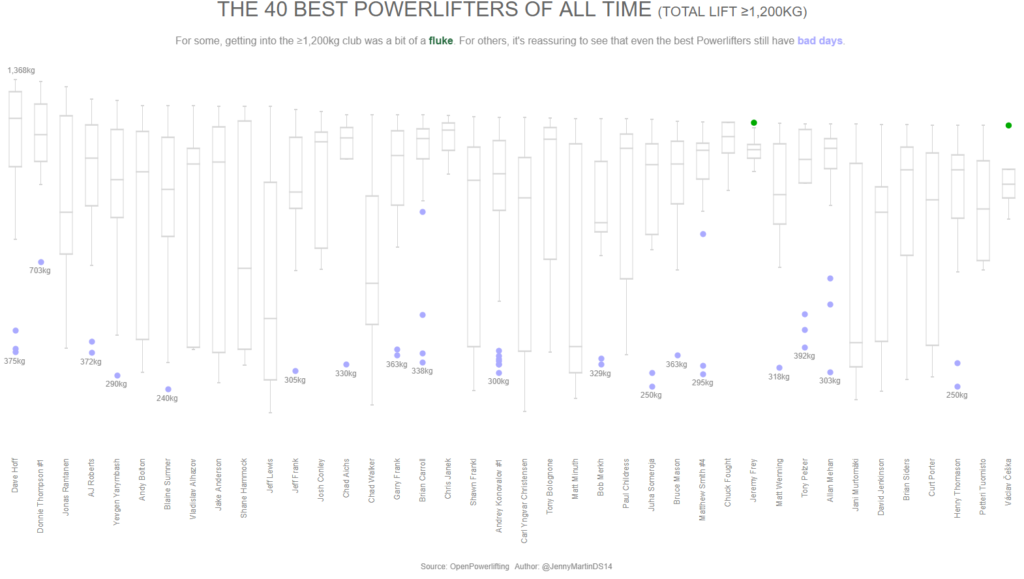
If I’d had more time, I would have liked the user to be able to change the axis for different metrics, rather than just focus on the total lift. Alas, it wasn’t possible in the time today!
Overall, I’ve really enjoyed Dashboard Week! It’s made me feel more confident in my Tableau and Alteryx skills. So thank you Andy, Nick and Lily!