


Day 3 saw us building dashboards based on Bicycle traffic data. Full details here: https://www.thedataschool.co.uk/andy-kriebel/ds28-day-3
My plan was to add on collision data, and join in via a spatial match in Alteryx - ultimately I couldn't get this to work in the time we had but with a bit more tinkering I think I could. In the end I used a Tableau relationship model.
Here was my initial plan:
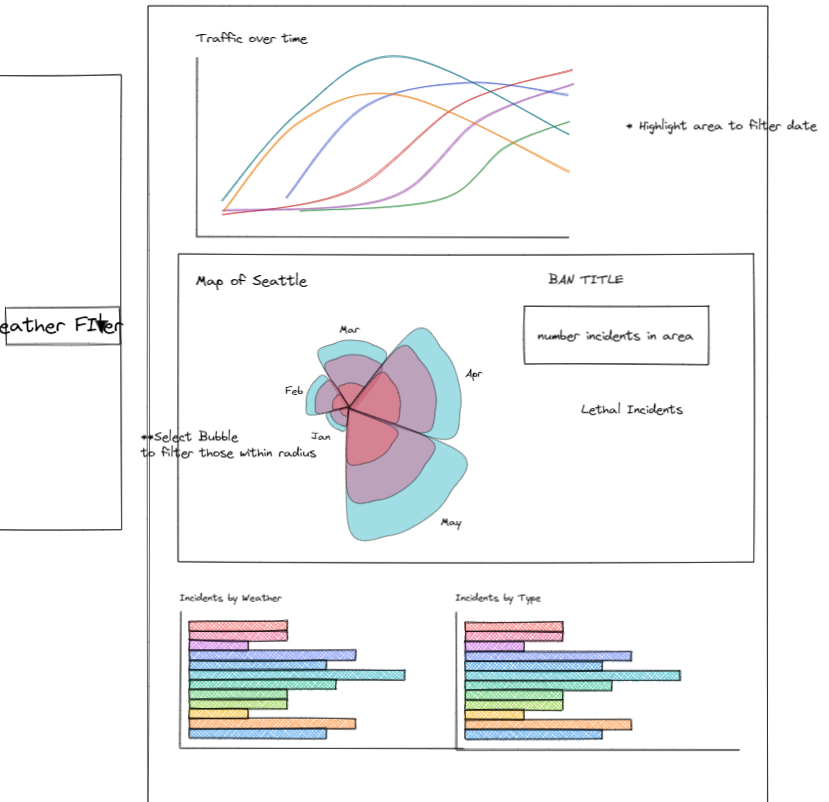
The plan included time series charts showing cycling trends over time, a map view with some BANs and some bar charts. Ultimately my final design followed this quite closely.
Here is my Alteryx flow:
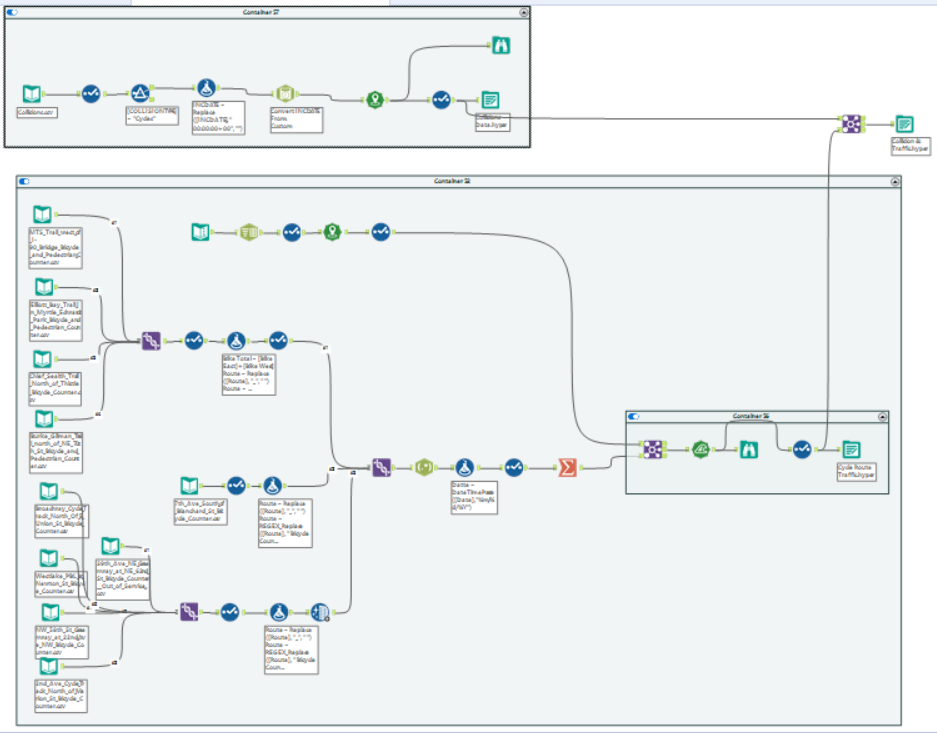
The main part involved unioning all the traffic data and removing pedestrian traffic. I also aggregated the data up to a day level instead of an hourly level as the collision data was a bit of mess with the times so kept it simple for this analysis.
Here is my final dashboard:
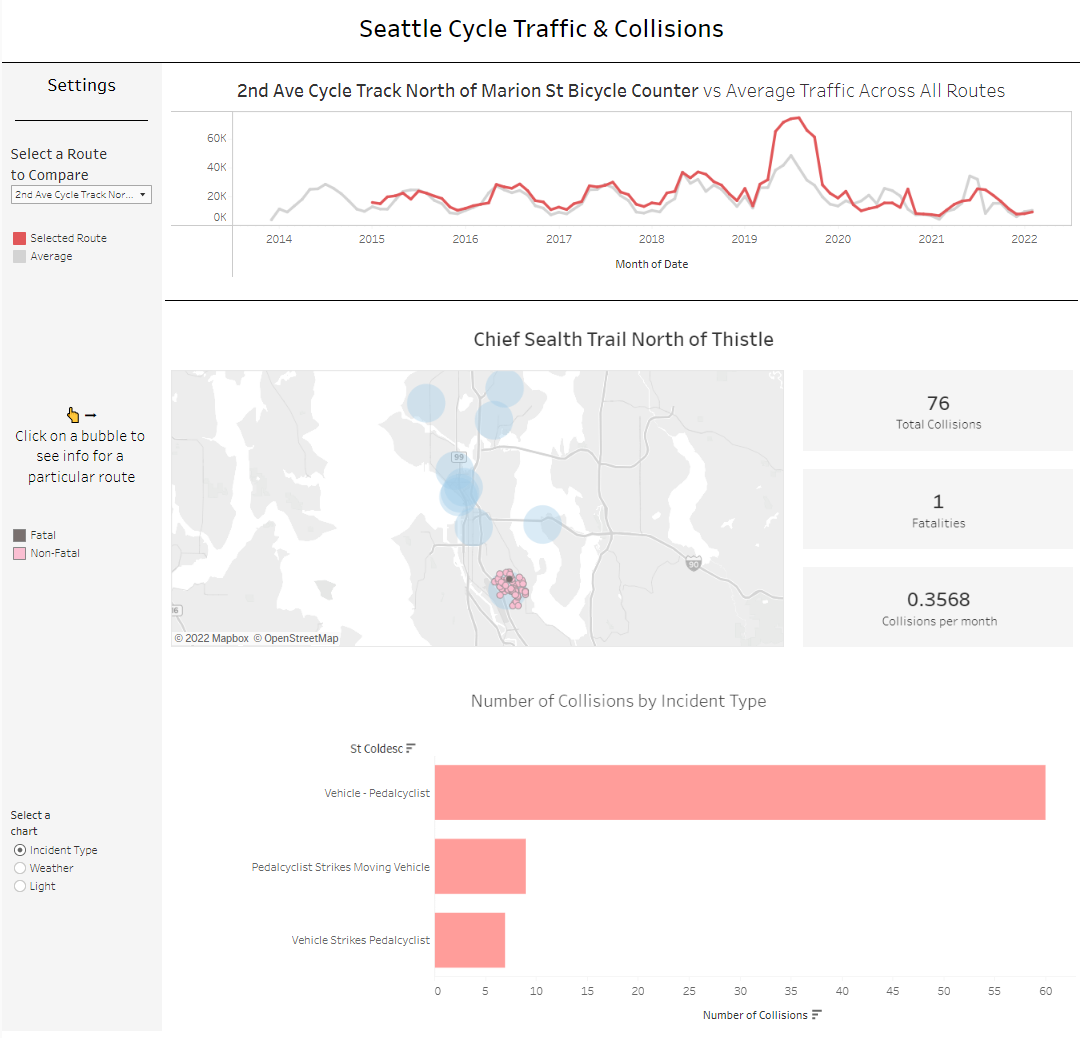
Ultimately is follows most of my plan, although there isn't any date filter as the relationship model wasn't allowing me to filter by date but I think with a little tinkering I could get this to work.