In this short piece, I’m going to explain how you can use the pages shelf to animate your trend lines (or other charts such as maps). You may also want to use it to flick through views at different points in time on one chart. This creates a nice effect which can be seen below.

In the example I am showing, I have used two measures on a dual axis which are synchronised, however, the same effect can be achieved with a single trend line. First of all, you must create a line chart, with your continuous date pill on the columns shelf and your measure(s) on the rows shelf. In the example, the continuous date is by month, but this can be set for your own preference.
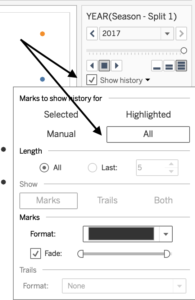
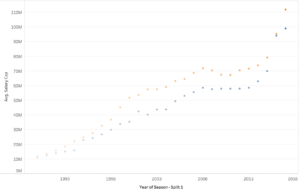
Next, you need to add your date pill to the pages shelf (above the filters card). I find it is best to leave this as year unless your data is only over a period of months in one year, otherwise, the tracking won’t work correctly. Now you will want to select show history and select ‘all’ on the marks to show history for. You may see that the option to show trails is greyed out, and when you run the pages shelf you see a sequence of dots as seen below.
The trick is… to change your mark type to circles. You will be now able to track the trails of your marks and modify them to suit your needs, perhaps you want some dashed lines in your charts. Hopefully, you find this simple yet effective trick useful in your work!