


Task
Data Preparation
Getting the data today was quite easy and smooth. we only had to insert an API endpoint and all the data was listed nicely on Alteryx. Luckily we didn’t need to do any pagination – only some data cleaning, nothing phenomenal.
I wanted for my viz to visualise planets orbit around the Sun – however after cleaning the data and pulling it into PowerBI – I realised that PowerBI doesn’t have Path field for lines neither Table Calcs – as I needed an Index() function to draw my orbits. So, I had to go back to Alteryx to do some data preparation to draw my orbits for each planet and their path. Here is my Alteryx workflow:
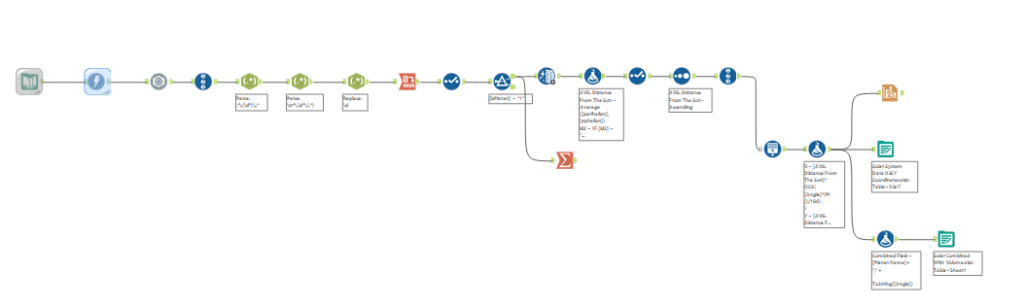
After creating the workflow in Alteryx – for some reason PowerBI wasn’t visualising the planets in the right order even though it looked correct on Alteryx as shown below:
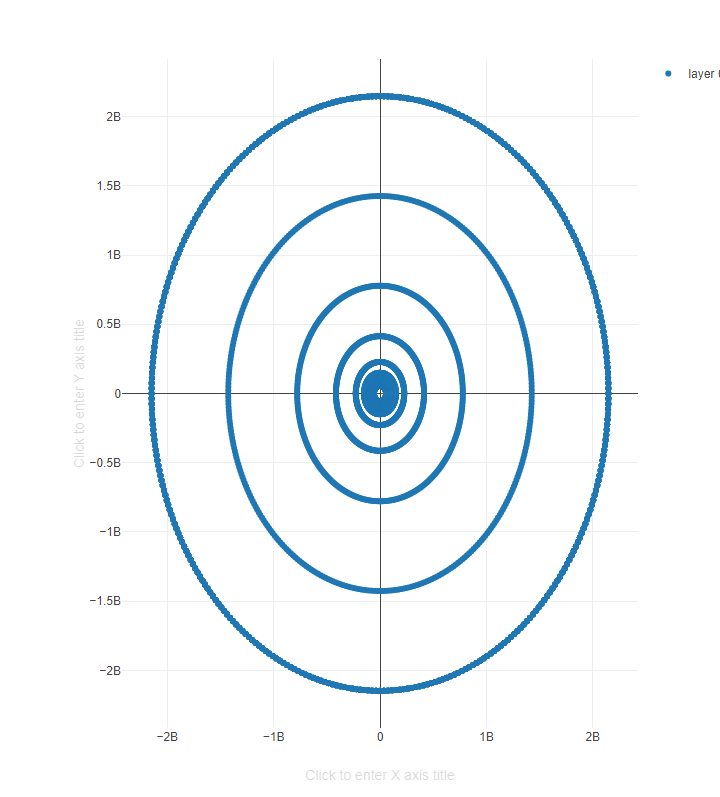
Anyway, to solve that problem, I decided to animate my viz and show how the planets orbit around the sun based on their distance from the sun.

PowerBI
From my 1 day experience with PowerBI, the only thing that the tool is good at is the transitions and animations – which are quite smoother than Tableau’s. Other than that, I can’t wait to get back to TABLEAU!
Here is the link to my viz: https://app.powerbi.com/view?r=eyJrIjoiOGZmMjE0N2UtMTJjMy00ZDdmLWFlMzctNzU2NGJkNmQyOGVlIiwidCI6ImNlZjk5OTUzLWM0OTYtNGE4MS1iMDYxLTNlYmU1ODRjY2ZjYyIsImMiOjh9