In this diagram I have made a Sales vs. Time area chart with Category under Colour, from Superstore. The problem with an area chart is that it can be hard to interpret. For example, it's hard to immediately know how many sales came from Technology in 2020 Q3. Compare that to Furniture where I can easily see that it has made ~55k in Sales.
One way to solve this is to sort the area chart such that you can select which Category is placed at the bottom of the area chart. Here's how:
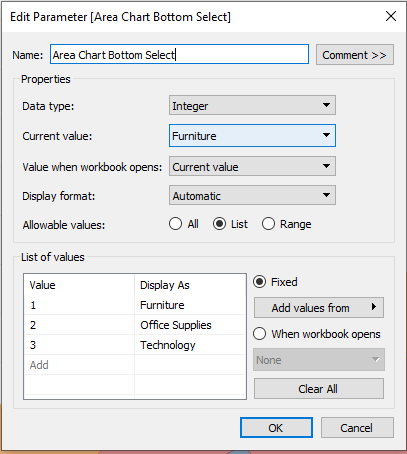
- Create a parameter with the following settings. Change/add the categories as required, under 'Display As'.

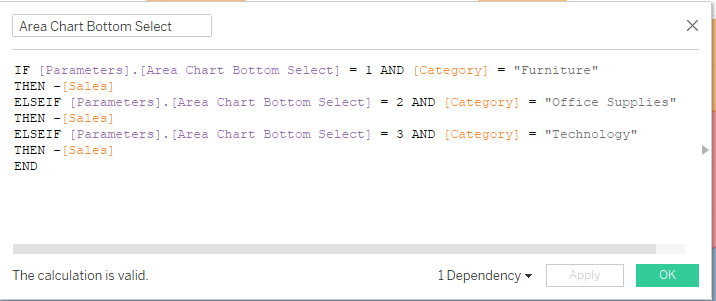
2. Create a calculated field with the following IF statement.

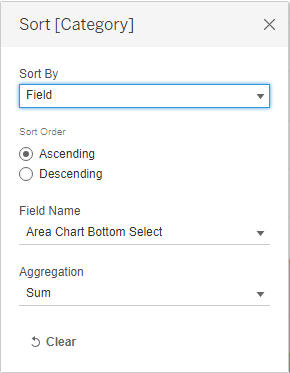
3. Select the Category colours pill and sort the field like so.

And voila! You can now use the created parameter to force the Category of your choice to the bottom of the area chart.
