This week at the Data School we learned how to use Tableau Prep to prepare data. After training with the tool in the morning we were given the afternoon to find a data set and use Tableau Prep to clean it before visualising it in Tableau. I chose the results of online personality tests taken across the world taken from here. The data included a breakdown of gender, race, right or left handed, country, English as a first language and age, as well as the rating score between 1-5 for each statement. There were a total of 50 statements each with their own column.
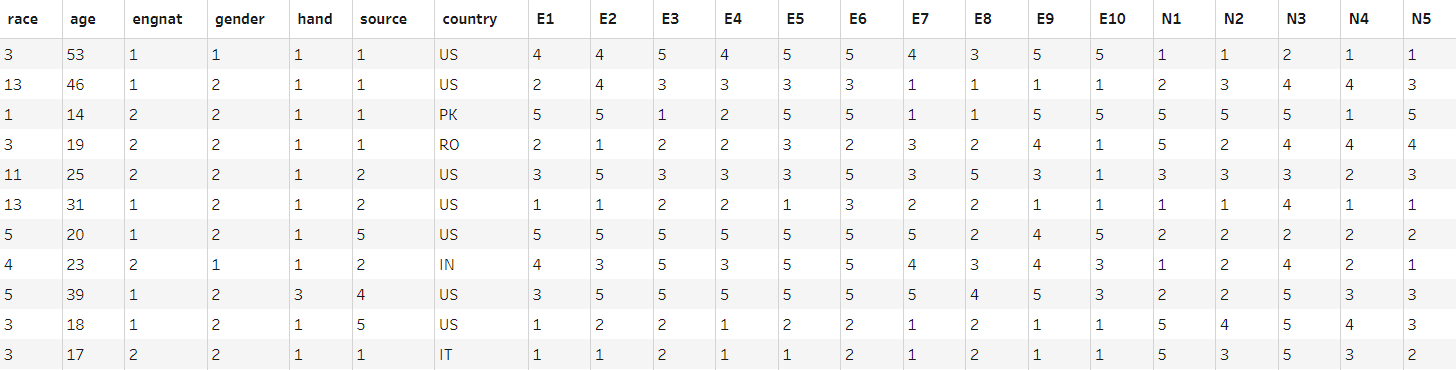
Original data shown in Tableau Prep E1-10 are extroversion statements
To start preparing a step was inserted and null values and implausible ages were removed. It was also the case that half of the statements were worded negatively. This meant that for the metric to make sense (those well represented by the attribute scoring high whilst those not well represented scoring low) these negatively worded statements would have to have their scores flipped. This was achieved using calculated fields which updated the relevant columns by taking their values from 6. The highest rating of agreement with a statement was 5, therefore if a participant fully agreed with a statement that they are not well represented by the personality attribute in question their score would be changed from a 5 to a 1 and their score for the attribute would be appropriate.
With the scores now showing relevant values allowing for an average attribute score, and the nulls/incorrect values removed the columns for each statement had to be pivoted into a single column. This was necessary in order to have a column to aggregate statement scores into total average scores for each personality attribute. This as achieved by adding a pivot and placing the statement columns into the pivot values shelf. Another step was then added and the pivot names and pivot values columns were renamed “Question” and “Score.” More formatting was then completed in this step, such as the headers of the other columns being renamed and capitalised.
The race, gender, handed and English language columns were all coded using numbers and so were updated using calculated fields if statements or by simply double clicking and renaming the values, so that for example “1” became “male” and “2” became “female.” The countries were listed as ISO codes which are hard to understand so a dataset containing the codes and their subsequent country names was added. This was then inner joined to the original data on code and the code columns were removed in the following step so that only the country names remained. A calculated field was then added which duplicated the Questions column, and the statements were then grouped into the appropriate big 5 personality attributes.
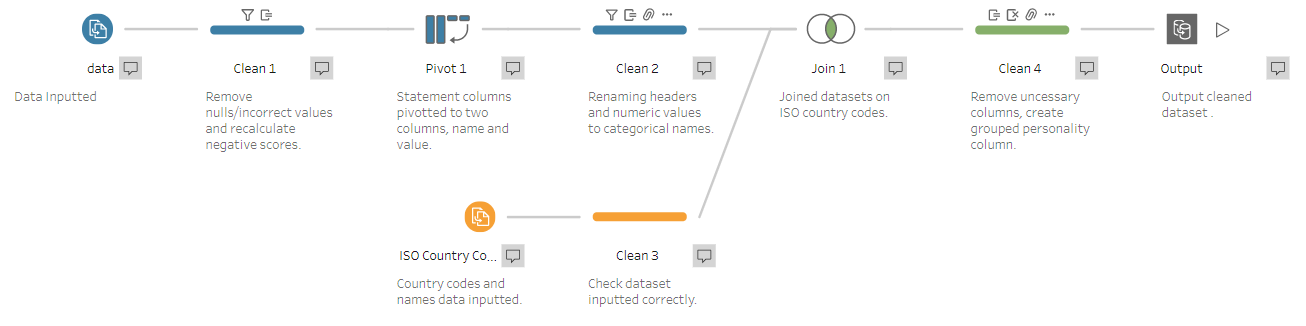
Completed workflow
The data now seemed prepared, each participant had a score for each statement which could be averaged to a score for each of the big 5 personality characteristics. After exporting the data and playing with it in Tableau I decided that I wanted to show the distribution of scores for each gender, but this could not be achieved as there was no unique values to plot for each participant, Tableau was aggregating the data as a result and so the full spread of results could not be shown. I therefore attempted to add a row ID column in Tableau Prep but this as not possible. As a result I had to resort to using Alteryx to add a row ID to the original dataset before running it through the Tableau Workflow again.
With each participants answers now having a unique ID I was able to plot the spread of answers for each gender and see if there were any differences. For the most part the spread and average for males and females was roughly the same. However, as was found in previous studies the greatest differences were in agreeableness and neuroticism and these ten to be larger in more prosperous gender egalitarian countries. The viz can be found here.