Dates in Tableau will behave differently depending on whether they are a datepart (blue) or a datevalue (green). This affects how the axes display/behave and also how visualisations such as line charts will display. The difference essentially boils down to dateparts behaving like a dimension as opposed to a measure which is how datevalues behave. This means that dateparts behave like discrete categories on the view whereas datevalues are more like continuous numeric values. I will go through some examples of this difference below.
You can tell the difference between a datepart and a datevalue by the colour, with dateparts signified in blue and datevalues signified in green. Right-click hold and dragging a date to the view will give you the range of date options available. The first pane gives the option for all dates to be displayed as either a datepart or datevalue and the difference is explained in brackets, as either discrete or continuous. The second pane gives all the datepart options, they have the numeric field icon in blue signifying that the numeric part of the date will be displayed as a category (depends on the type chosen, for example if month January = 1 etc.). The next pane gives the options to give the count and count distinct of dates, these are single numeric values as opposed to dates. The option to get the minimum and maximum dates are also in this pane which behave as continuous measures and so are datevalues. However for the min and max dates to behave continuously there needs to be something on detail which results in more than one min/max date, otherwise the single minimum/maximum date across the dataset will be all that shows. The third pane gives the datevalue options and these have a green calendar icon indicating that they will provide continuous dates as opposed to a part of a date returned a category. The final pane gives the option for an attribute of date which returns the date if the date in the row is unique (min([date]) = max([date])), otherwise it returns a ‘*’.
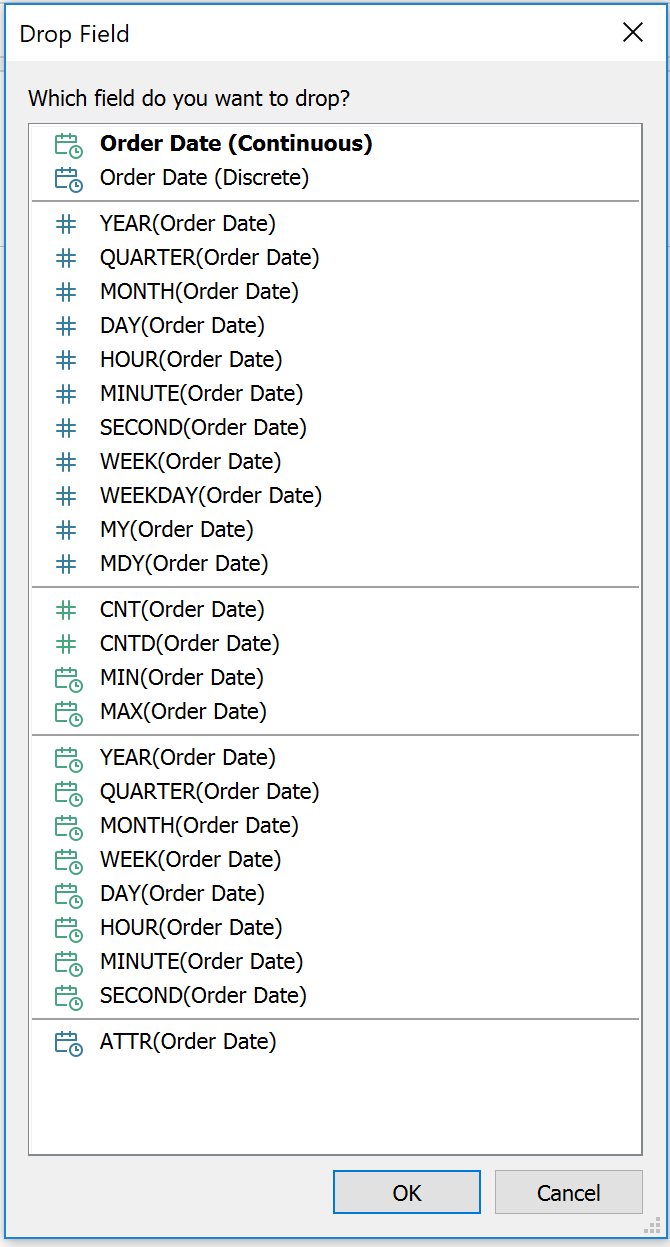
Date Options
When choosing a level of date that is less than a year the difference between dateparts and and values becomes most apparent. The datevalues will display all the values of the date type chosen continuously, for example from January 2015 to December 2018 by month. Whereas dateparts will aggregate up to the level of date chosen alone, so choosing month would give the months January to December (or however many are included in the dataset) and these would have the aggregated measures for all years in the dataset. Datevalues are useful in that they show all of the dates aggregated to the level of date desired so you can see month by month or day by day etc from the start of the data so you can see the trend over time. Dateparts are useful because they allow a comparison of the parts of the level of the date chosen so you can compare month sales as a whole for example. This can also be useful when it comes to adding other dateparts to the view. For example adding datepart at the level of year to detail/colour with datepart at the level of month on the columns shelf will display a line for each of the years in the dataset from January to December. This allows for a direct month by month comparison across years in the dataset. Adding datepart at the level of year in front of datepart at the level of month on the columns shelf will give all the months by year from the start of the dataset as opposed to just 12 months but each year will be broken into separate panes as each is a different discrete part. This differs from datevalue by month as the line from start to finish will be broken up at the end of every year instead of one continuous line.
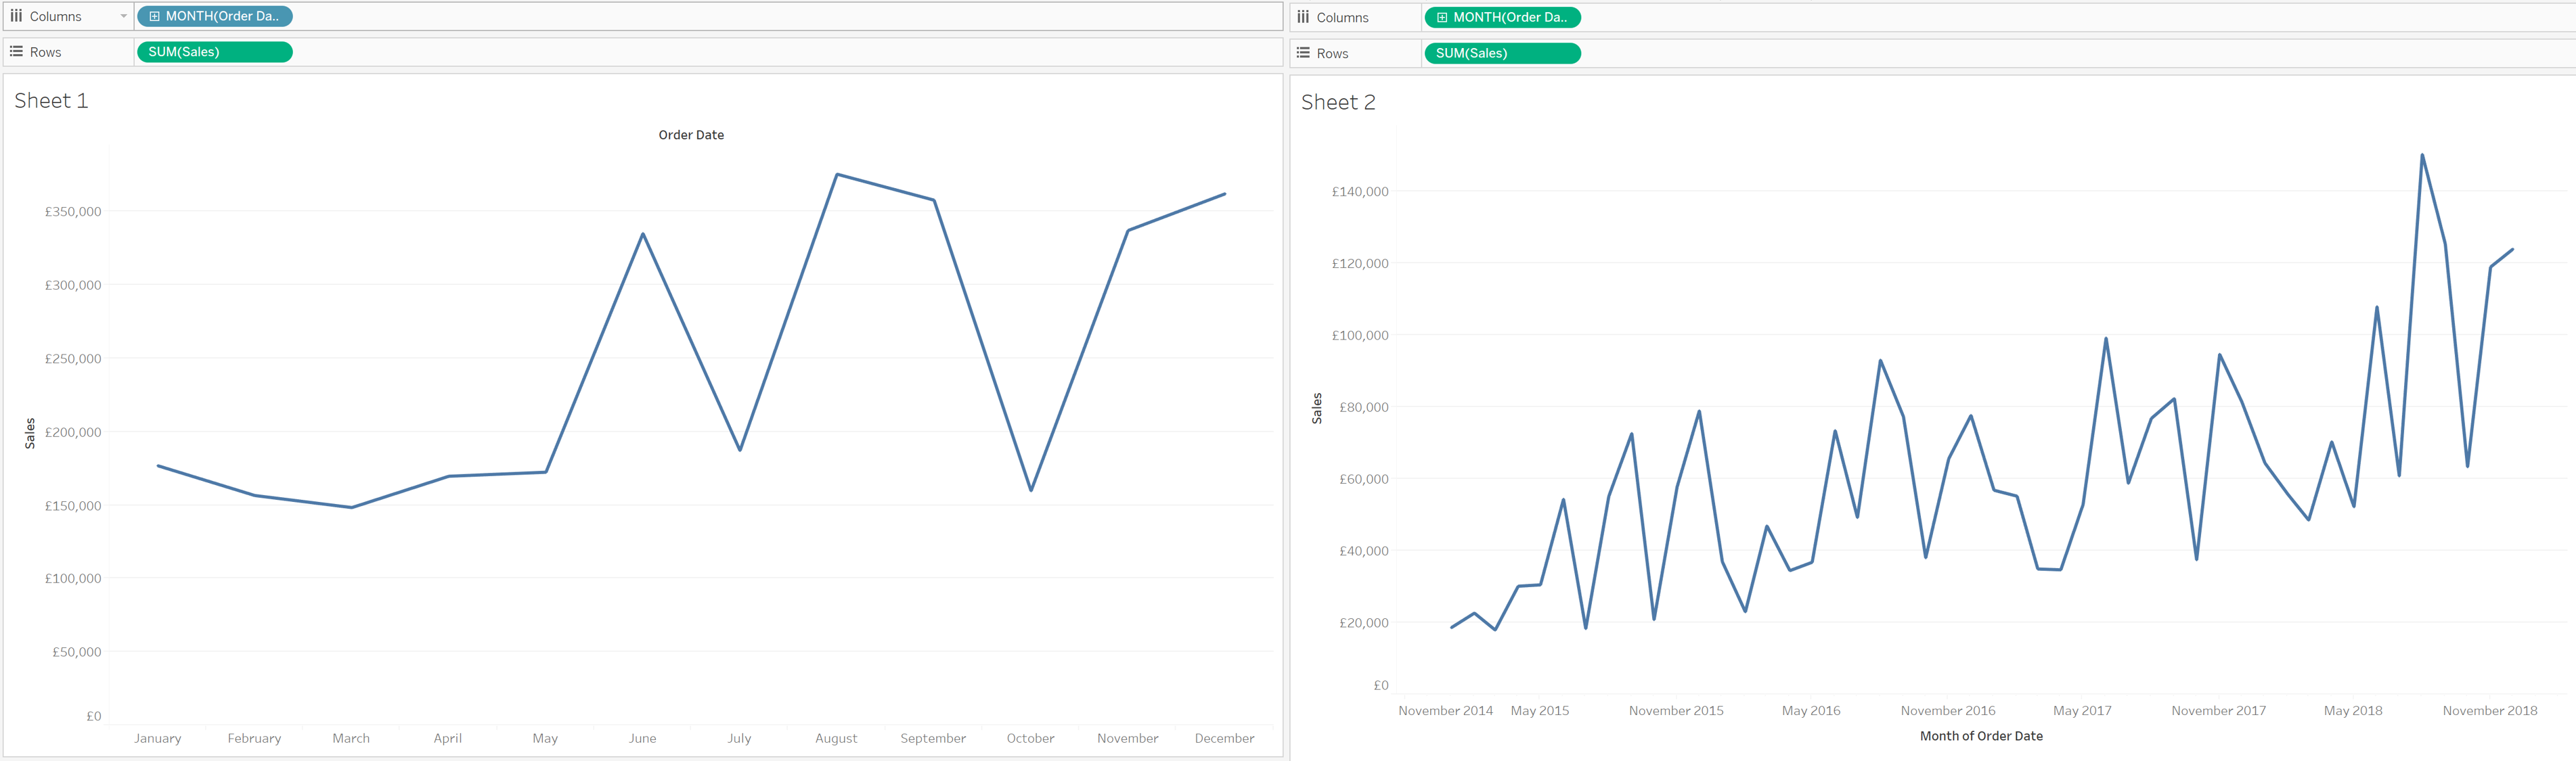
Datepart vs datevalue as month
It is also possible to display month by month or day by day from start to finish in the dataset using dateparts by selecting MY and MDY in the datparts pane. MY displays every month and year combination each as their own datepart, and MDY displays every day of every month and every year as their own dateparts. This may seem like the date is now displaying continuously as they go from start to finish but they will still behave as dateparts. Another difference between the date types is colouring based on a condition for example sales more than £1000. This will split both datetypes into two lines, but for datevalues both lines will be continuous whereas the lines will only show for dateparts when the condition is met for each part so for a continuous line each consecutive datepart must meet the condition.
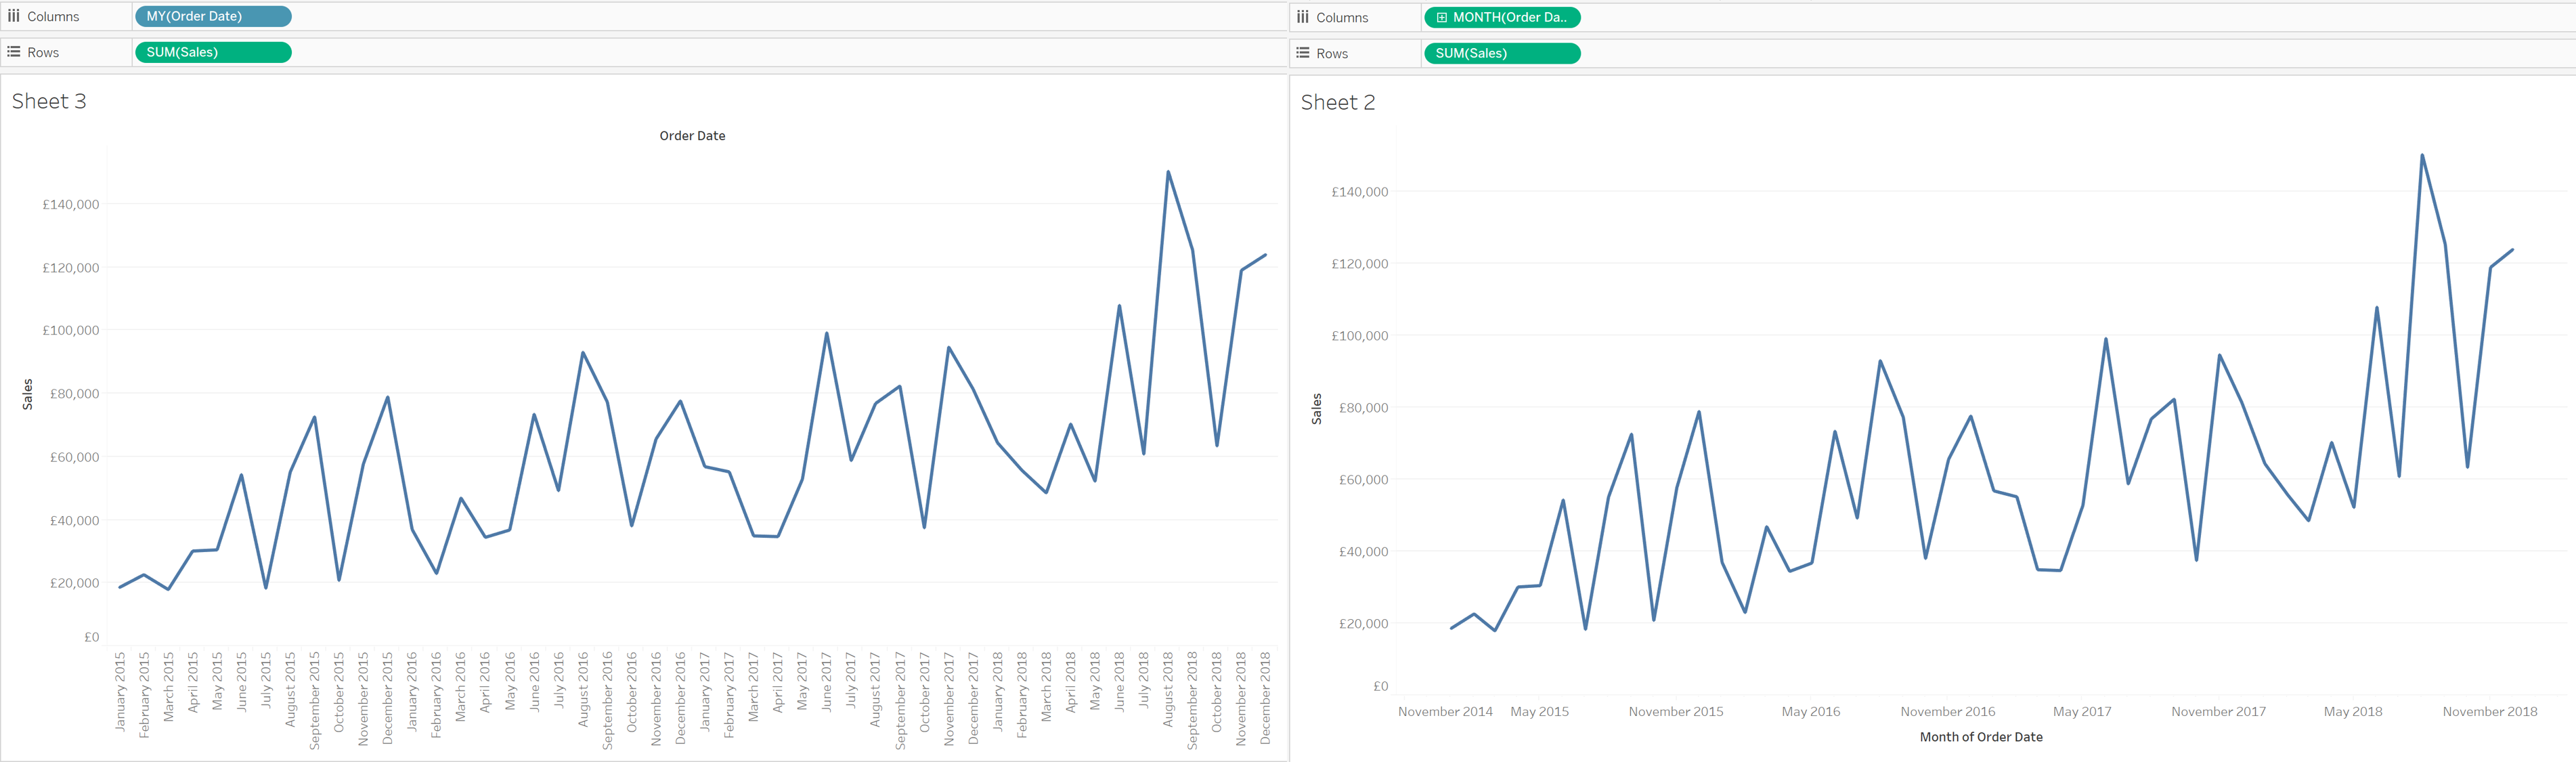
Datepart as MY (month-year) vs datevalue as month
Dateparts and datevalues also differ in terms of filtering. As dateparts are discrete they behave the same as dimension filters. If all dates are used on the filter then each individual date will be a datepart that can be selected/excluded. This is the same for each level of date, if datepart months is placed on filters January to December will be tick-able options in the filter. This also means that conditions and top/bottom filters can be applied to datepart filters like any other dimension filter. Datevalues placed on filters behave like measure filters. A min and a max date can be set and there is a relative dates option which allows you to choose things like only show the previous 3 months or years etc.
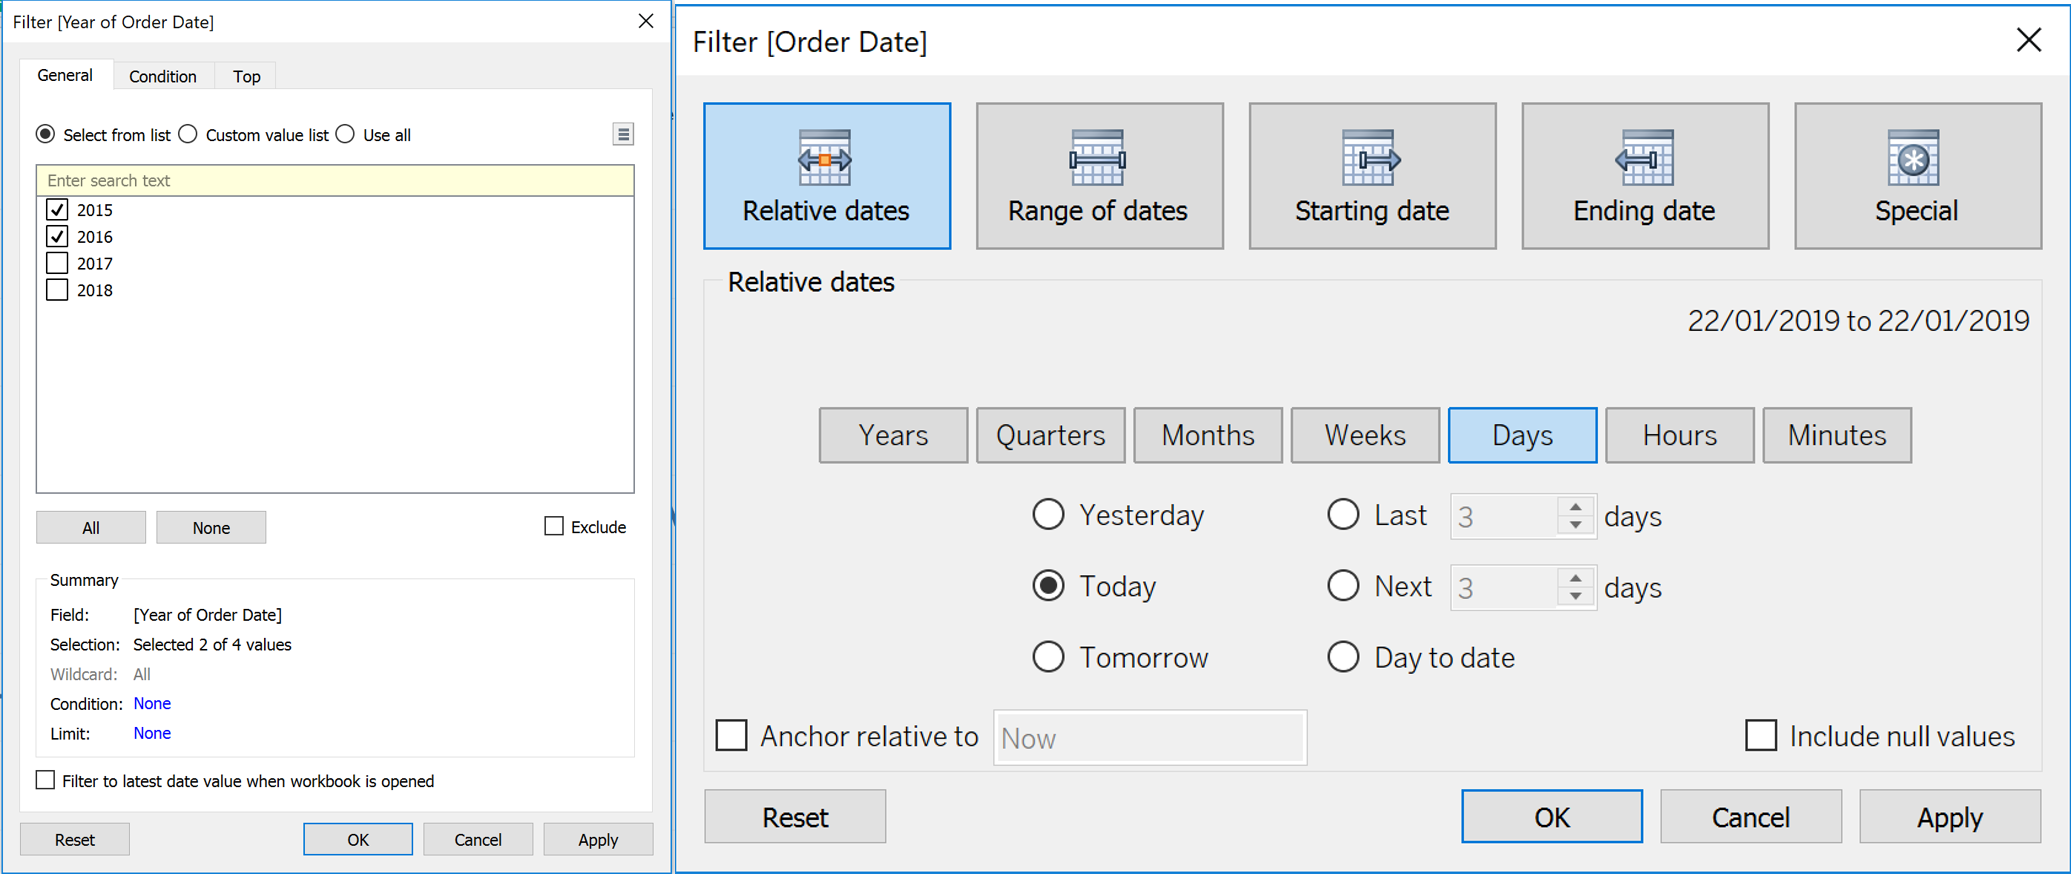
Datepart vs datevalue filters
When it comes to axes the date types again differ, behaving like dimensions and measures. Dateparts start immediately at the axis and list each datepart similar to how other categories on the column shelf align horizontally. Specific dateparts can be excluded by right clicking the axes and choosing exclude but there aren’t many other options. Datevalue axis are measure axis and so can be edited. This allows for automatic or fixed scales, reversing of the axis, renaming of the axis and customisation of tick marks. Reference line and reference bands can also be added to datevalue axes.