Gantt charts are similar to bar charts, but they have a specified starting point and a dimension to define the length of the bar. They are mainly used for time analysis, project management and timetabling.
For the client project last I was tasked with analyzing shift data and so I decided the best way to visualize this was with Gantt charts. I’d like to thank Dan Farmer and Andy Kriebel for their help this week!
I have created a mock data set for this example:
| Shift Name | Start Time | End Time |
| Shift 1 | 01/01/2020 09:00 | 01/01/2020 17:00 |
| Shift 2 | 01/01/2020 09:30 | 01/01/2020 17:30 |
| Shift 3 | 01/01/2020 14:30 | 01/01/2020 18:00 |
| Shift 4 | 01/01/2020 17:30 | 02/01/2020 02:30 |
PART A:
I started with the following steps in Tableau:
- Drag the Start Time onto columns choose to view the date in continuous Hour format.
- Next you need to calculate the length of the shift so create a calculated field.
- Place this ‘Shift Length’ calculation on the ‘size’ mark and change the chart type to Gantt.
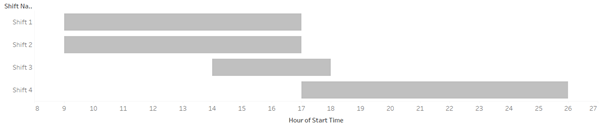
The issue with this is that as we have chosen the ‘hour’ part of the date we can’t see the difference between the shifts which start on the hour and those that start on the half hour. Unfortunately there isn’t a hour and minutes date part on Tableau so we have to do some more fiddling with the format of the start date.
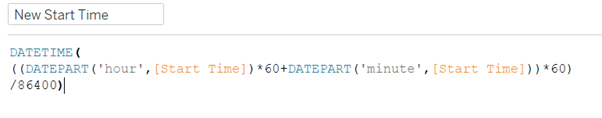
To change the start time we need to convert it into minutes so we use the calculation below. This means to grab the hour part of the date and add on the minute part of the date. To convert to seconds we have had to times by 60 and divide by 86400 (60 seconds in a minute, 60 minutes in an hour and 24 hours in a day: 60*60*24=86400).
We now need to make a new calculation for the shift length:
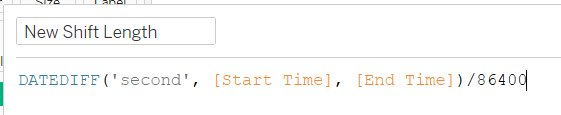
The view is now looking more like what we would expect:
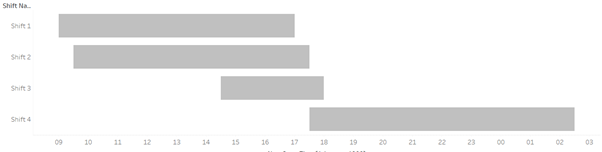
We can see that shift 2 is now starting at 9.30. However the next issue is that we have an axis which spans 2 days (9 am to 3 am). To solve this we need to do some data prep so lets go to Alteryx.
PART B:
Alteryx Workflow:
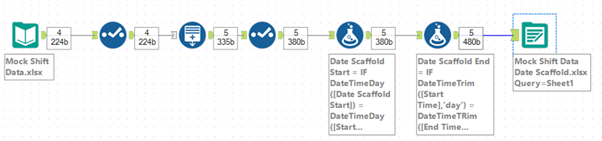
The steps of this workflow are as follows:
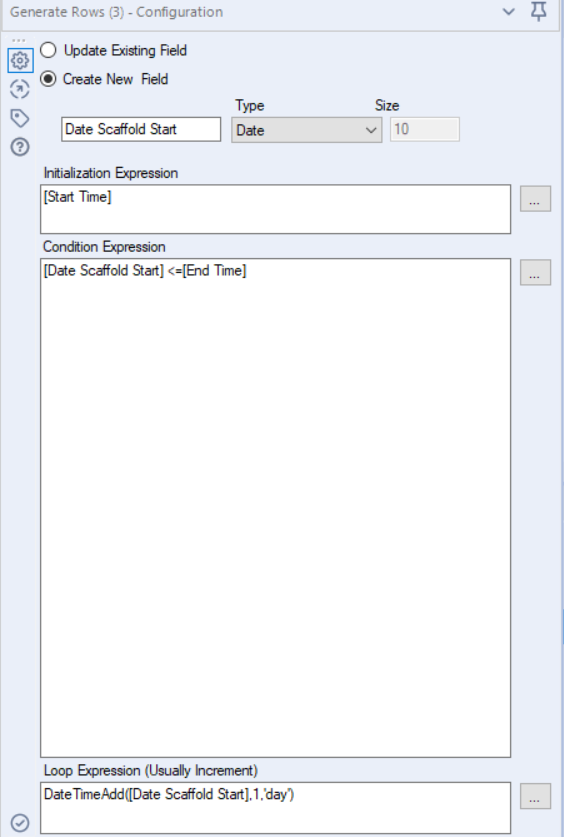
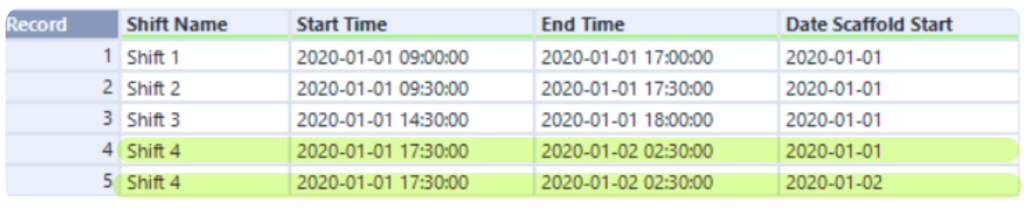
- Use the ‘Generate Rows’ tool to create a new row for if the shift spans onto the next day. You can see in the results below that there are now two rows for Shift 4. Make sure to create the new field as a ‘Date’ type.
2. Use the select tool to change this field to ‘Date Time’ – this will default to have 00:00:00 as the time.
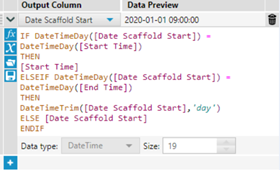
3. Next we need to use a formula to allocate the correct time of day to the new scaffolded date. We use an IF statement which reads as the following: if the date, time and day of the new scaffolded date equals that of the original start time then return the start time. If not then if the date, time and day of the scaffolded date equals that of the original end time then return the day part of the scaffolded day, else return the scaffolded date.
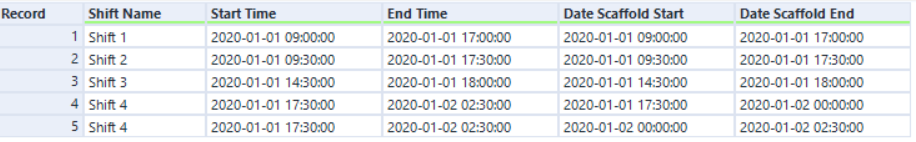
4. Repeat this process for the end date and you should see something like the following:
PART C:
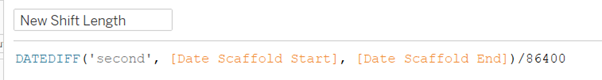
Back in Tableau edit/refresh your data source in tableau and edit your ‘New Shift Length’ calculation to use the date scaffolded start and end date:
We can now see that for shift 4 which is 17:30-2:30 now wraps back around.
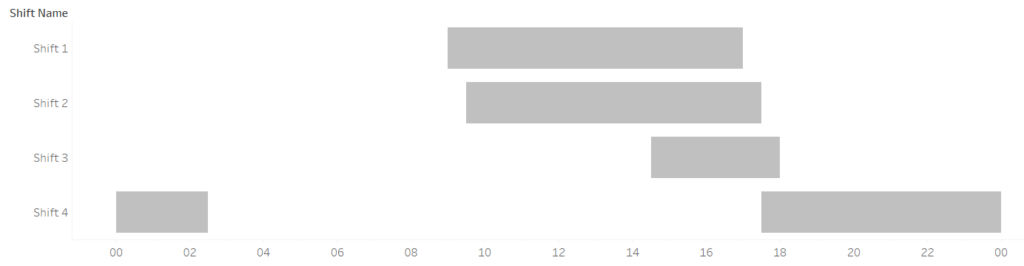
We now have a correct functioning Gantt Chart!
