Today was a better day for me – yay!
I was stuck in a bit of a self-hate cycle yesterday. I have always had a habit of comparing myself to others in various aspects of my life, and unfortunately this has followed me into the world of work. It doesn’t help that I am working alongside some super clever and innovative people and so when it comes to presentation time (especially this week) I am left feeling a bit disheartened and disappointed in myself for not creating things as good as everybody else has.
However, I came into today in a much more positive mindset. This is thanks to Ollie who wrote me a lovely long post trying to rationalize this comparison habit. I thought I’d just quickly summarise the key points he made so that if anyone who is reading this is also struggling with the same thing it might help them!
- Comparing isn’t a level playing field – you know everything about what has gone into your own work but only see the finished product of everybody else’s.
- Your comparisons are biased – I am comparing my work to others who are amongst the top Tableau and Alteryx users in the world. Additionally, you also only see other people’s ‘best’ work that they choose to share.
So today I went in with a much more positive attitude which definitely helped me to focus!
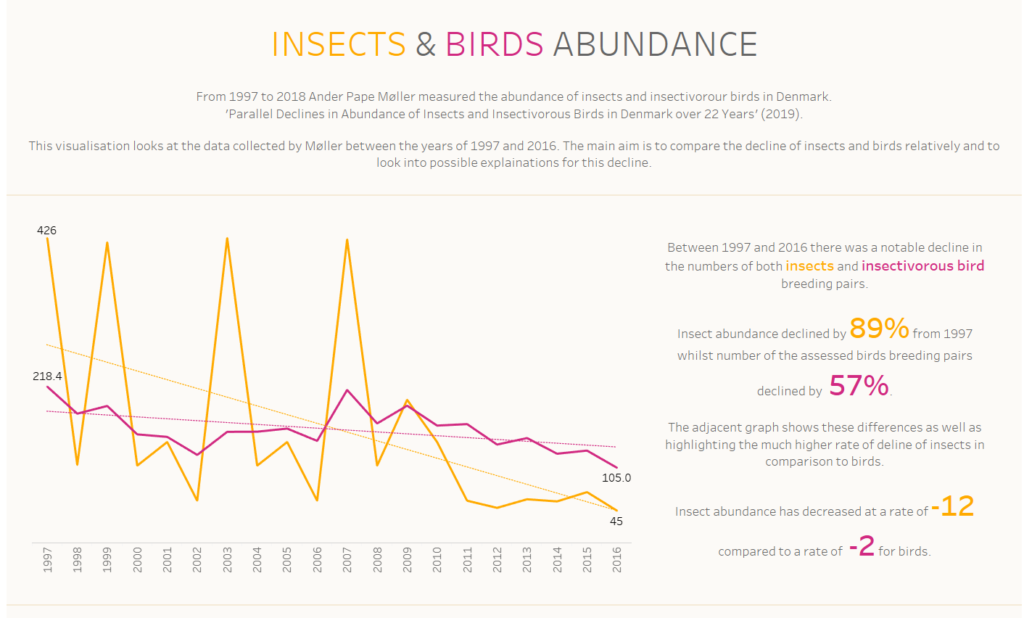
The dataset today was one taken from a research paper which analysed the number of insects and insectivorous birds over a 22 year period in Denmark.
The first step of the day was to read the research paper which definitely helped to give a thorough understanding of the data as well as background in the topic.
The data prep was relatively straightforward today apart from some very questionably formatted dates. I decided early on to focus on the insect dataset and the bird one and to ignore the ‘car’ dataset as Moller had noted that there was little statistical relevance of this in his paper.
Once I had the data in a format which made sense I moved into Tableau. Here I mad numerous different graphs and charts just to see what I could find that I found interesting to dig deeper into for my analysis.
I decided to compare the change in number of birds and insects overtime and to try and gain an understanding as to why insect numbers have decreased a lot more and at a much severe rate than numbers of birds.
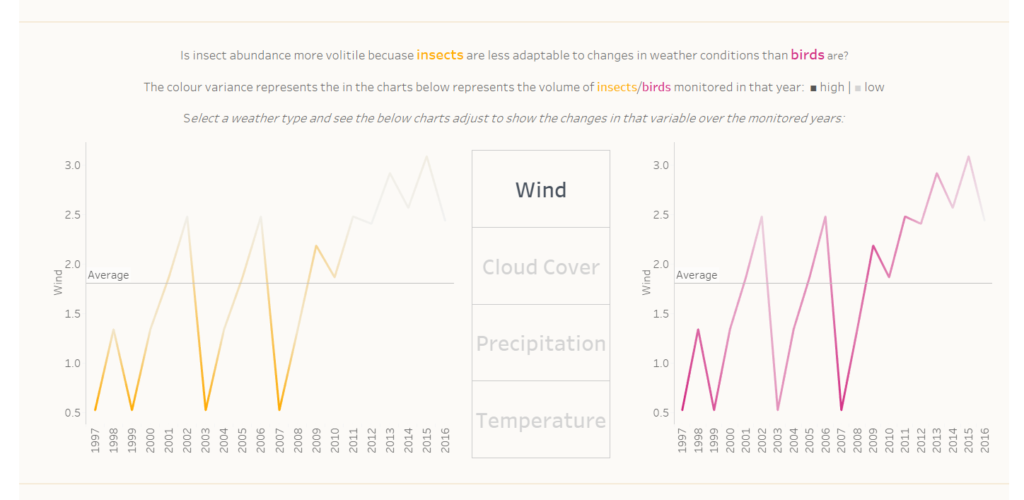
My analysis helped me come to the conclusion that it is likely that the number of insects are more volatile than birds because they are less adaptable to changes in weather conditions. Insect numbers are notably greater when the weather is less extreme (less rain, wind and cloud). Whereas, in comparison, bird numbers don’t differ greatly in response to weather changes.
I’ve always wanted to create a dashboard which is a bit more report/article like with more text as most of my dashboards are, well, dashboards so I’m happy that I used this opportunity to create something a bit different.

One day to go! Lets hope we can finish on a high tomorrow!
