LODs (Level Of Detail expressions) are a very special type of calculations in Tableau. They are the ones with the curly brackets. But that’s not the end of the specialness. LODs can change the level of aggregation that the calculations are performed for and also confuse many people…
Within the past two weeks, I had the opportunity to teach LODs to the public and a younger cohort and so I had to wrap my head around LODs themselves.
How I started with LODs?
To be honest, I expected more people to have played with LODs. This assumption is strongly biased by my own experience. I had an idea and wanted to get something done but couldn’t figure out how to do it. My first thought was to google it and so I came across these calculations with curly brackets around them. I wasn’t sure how it was working and what exactly was happening but after enough playing around, I managed to figure out how to use FIXED LOD, while being absolutely oblivious to INCLUDE and EXCLUDE…
Fast forward to a few weeks in the Data School and I had to teach this bloody thing to the public. It’s fine though, after a few tries I think I got it sorted(-ish).
For the purpose of this blog post, I’m using Sample – Superstore data available in Tableau.
Back to basics: blue and green, dimensions and measures
In order to understand LODs we need to understand how Tableau calculates the data you have in the view.
Blue vs Green – Measures
If you’ve played with Tableau, you probably have noticed that the pills you drag to use various fields are often blue or green. The colour corresponds to whether the field is considered discrete or continuous. (Check out Déb’s blog on this as well!)
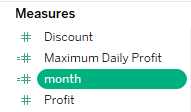
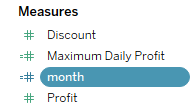
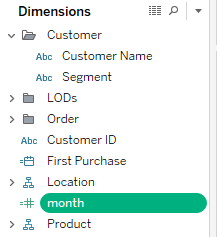
If you create a calculated field:
MONTH([Order Date])It will automatically land in Measures and will be green. (MONTH function returns the number associated with the month of the given date, e.g. 4 for April)
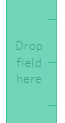
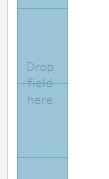
Dragging it onto Drop field here gives you a ruler on the side of your canvas. If you drop it there, you will actually get an axis:
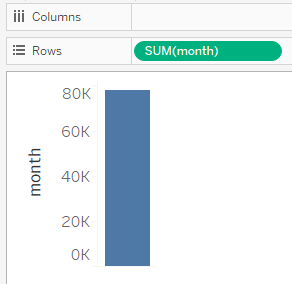
You can also notice that the month field is aggregated, there’s SUM(month) on the pill.
We know that month number is not really continuous. To indicate mid-April, you’d likely use something else than 4.5.
Let’s change the pill to discrete: right-click on the pill in the Measures section in the Data pane -> Convert to Discrete.
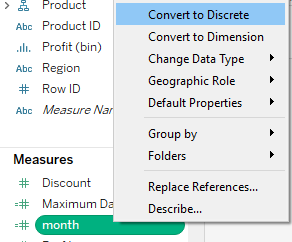
The pill now should be blue but still in Measures:
Dragging it onto Drop field here will give you separated rows on the side of the canvas. If you drop it there, you will get table-like looking rows:
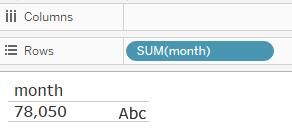
What we’re getting here is a single row that sums all month numbers: there’s still SUM(month) on the pill even though the pill is blue.
You can see now, that measures will be aggregated no matter if the field is discrete or continuous.
Blue vs Green – Dimension
OK, let’s try converting month field into a dimension. To do that, right-click on the pill in the data pane -> Convert to Dimension. The pill should now move to Dimensions section and should be blue.
If you drag it onto Drop field here, you will get separated rows but now instead of a summarised single value, you should get 12 unique ones:
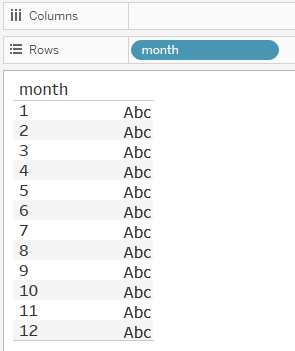
The view is now split by the unique values in the dimension and the data is not aggregated. The pill on Rows shelf has month on it, not SUM(month).
But what happens if we use a continuous dimension? Let’s right-click on month pill in the Dimensions section and Convert to Continuous. The pill now is still in Dimensions but it is green:
Dragging it onto Drop field here will show a ruler on the side of the canvas, just like it did for a continuous measure. If you drop it, you will again get an axis but instead of a single mark, you will get 12. One for each of the unique values of the dimension:
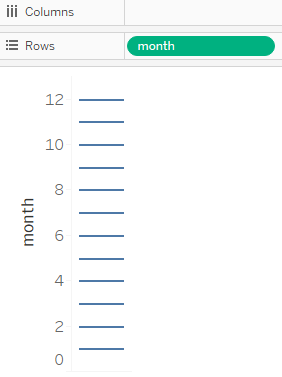
You can see that the pill is green and not aggregated: month instead of SUM(month).
Blue means discrete
Green means continuous
Dimension and Measures can be discrete or continuous
Dimensions have separate marks for unique values
Measures are aggregated
How are the values calculated?
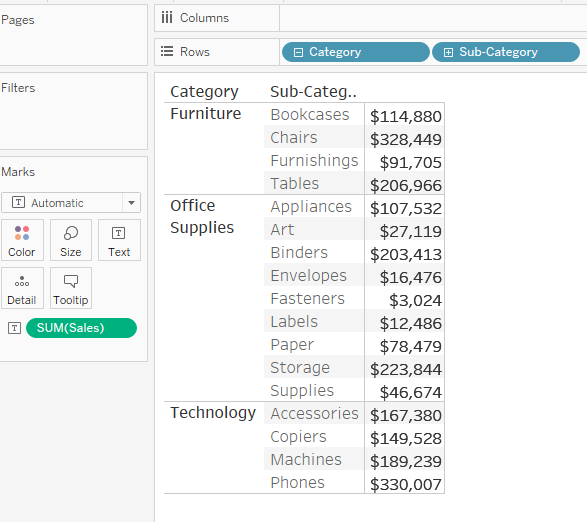
Whenever you add a dimension to the view, it will specify the level of detail you’re looking at. The more dimensions you have on your Columns, Rows shelves or Marks card, the more granular (or detailed) view you have. (This will also result in more and more marks.)
The measures will be aggregated to whatever granularity you have in the view. In other words, to the level of detail specified by the dimensions.
Below you can see just that. Starting with just SUM(Sales), I have only one value in the view. Whenever I add dimensions, I get more values for a more detailed look at the data:
Sometimes, you want to calculate things at a different level than what you have in the view. This is where LODs work magic.
FIXED Level Of Detail
Syntax
The FIXED LOD can specify the granularity of the calculation independently of what is in the view. This is what the syntax looks like:

The keyword is the LOD type: FIXED, INCLUDE or EXCLUDE. In this post, I will only cover FIXED, I’ll write about INCLUDE and EXCLUDE in one of my next blog posts. The list of dimensions can have zero, one or multiple fields. Whenever there is more than one, they should be separated with a comma. After a colon, there is the aggregate expression, where you can also use if-statements (as long as they result in an aggregate expression). You cannot use table calculations or attribute function in LODs.
Translate to English
The syntax may be a bit off-putting for some and not that intuitive, so it’s good to know how to actually understand it. In order to ease this process, I’ll use a method that Coach Andy describes in his blog FIXED LOD to plain English.
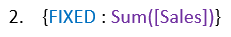
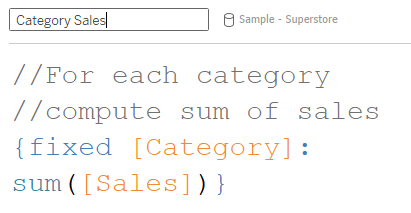
You can translate your FIXED LOD as ‘For every dimension calculate the aggregate expression’:
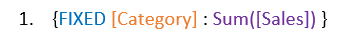
Translates to: For every Category, calculate the sum of sales.
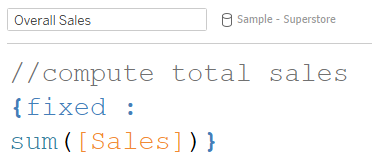
With FIXED, you can also not specify any dimensions. This will result in calculating the grand total for the given aggregate expression:
Translates to: Compute total sum of sales.
Pro tip: here, you can skip FIXED and the colon:
This will have the same result as FIXED on nothing.
Since we’re using fixed here, we don’t really care what is in the view. The data calculated for this calculation will be based on 1. Category and Sales and 2. Sales only.
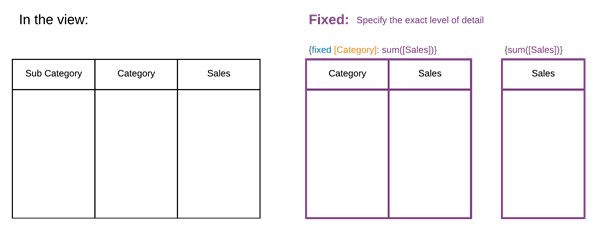
Each LOD is calculated separately, so the data the LOD is using will depend only on the LOD in question.
LOD vs basic calculations in the view
Let’s try and recreate the situation above. We want to have Category and Sub-Category in the view and look at sum(Sales). Normally, this means you will have different values for all Category and Sub-Category combinations. But we also want to compare these values with the Sales at the Category level and with the overall Sales.
Let’s prepare the view: Category, Sub-Category and Sales in the view:
Let’s create Category Sales (calculation 1 above):
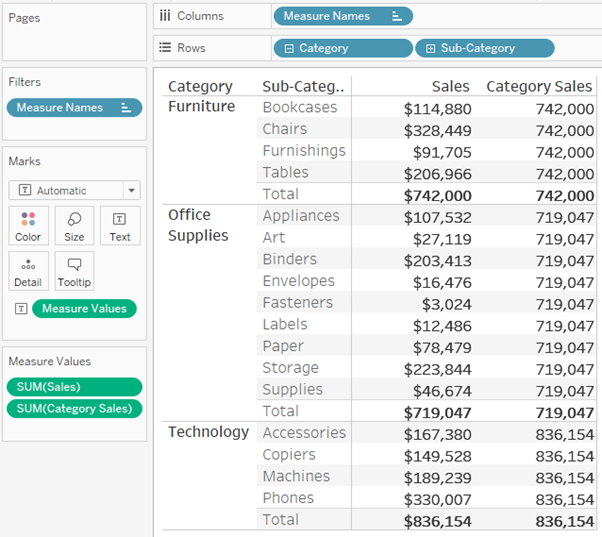
If I add it to the view, you can see below that for different Sub-Categories within the same Category, I’m getting the same values and for different Categories, I’m getting different values. I can also compare it with subtotals to make sure the values are correct:
Let’s create Overall Sales and add it to the view.
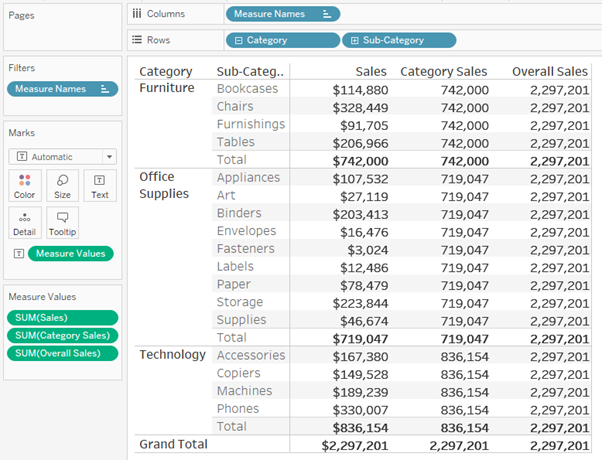
Now, I’m getting the same value for all of the rows, no matter the Category or Sub-Category. Comparing it with the Grand Total, I can see that the value is correct:
The difference between basic calculations such as SUM(Sales) and LODs is that the basic calculations will be computed based on what is in the view, whereas FIXED LOD will be calculated based on dimensions and measures specified in the LOD.
LODs in calculations
You may wonder why to go through all that trouble just to get the same values as in Subtotals and Grand Total. The totals are useful to compare values in the view but you can’t really use them in your calculations. You can, however, use LODs in calculations.
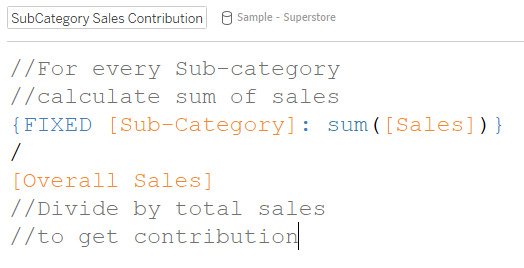
To compute Sub-Category contribution to Overall Sales, we can create another field Sub-Category Sales Contribution:
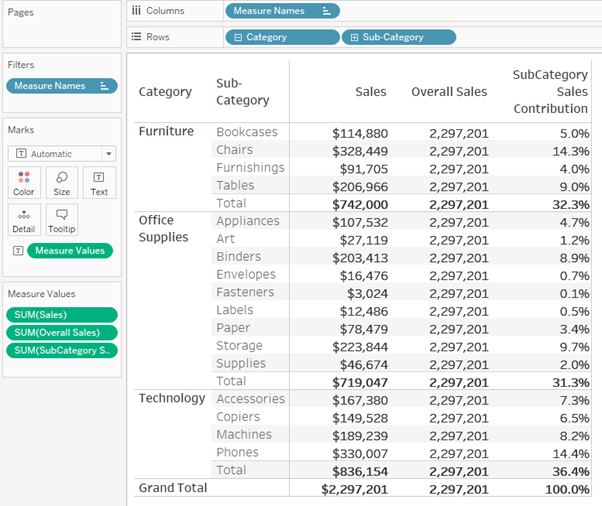
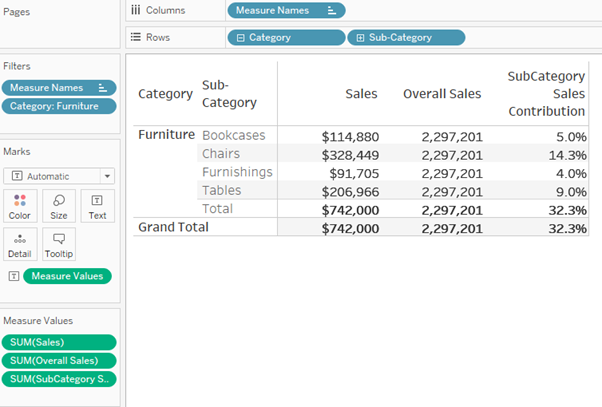
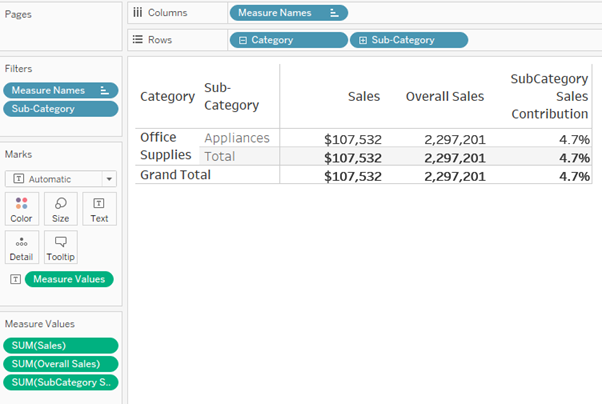
The advantage of FIXED LOD is that it also isn’t affected by dimension filters so if we now filter to only see Furniture Category or Appliances Sub-Category, the LOD values should remain the same, while the Totals will change their values:
I hope this clears out a few things and makes FIXED LODs more digestible. If you liked this and want more, look out for my future post where I’ll describe INCLUDE and EXCLUDE. There is also a webinar recording available on youtube and check out the workbook I used in that webinar on Tableau Public.