For Day 4 of Dashboard Week we were tasked with looking at Candy Survey data between 2014-2017. Andy stated that we could only use Tableau Prep Builder to clean our data and Tableau Server’s Web Authoring function to build our visualisations.
Tableau Prep
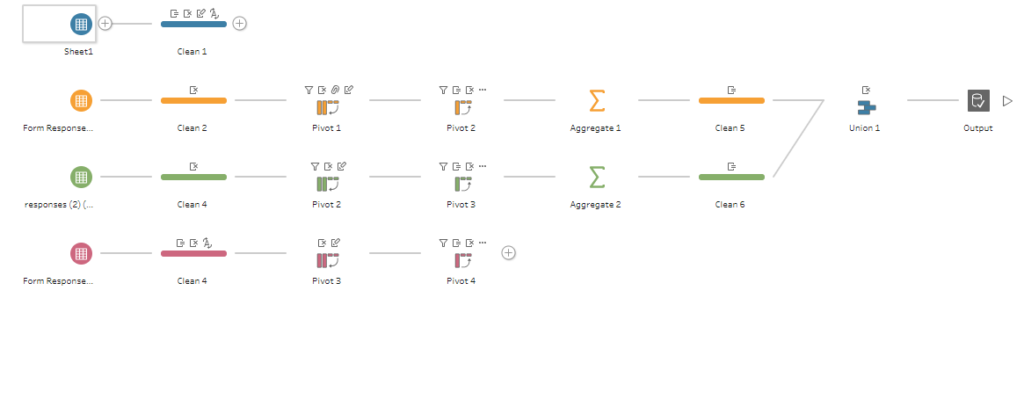
I downloaded the four separate years and inputted them into Tableau Prep. Initially, I wanted to use every year in my viz but, some of the key fields like Age, Gender and State were not available for all of the years.
I decided to focus on two years (2016 and 2017) and generally cleaned the data via the self-explanatory ‘Clean’ function and pivoted the items (Candies) into one column. I did some more cleaning by creating calculations and filtering out some irrelevant data. I also grouped some data which were the same but were formatted differently. Towards the end of my workflow, I aggregated some of the fields to have the measures that related to each item. Finally, I used the union tool to merge the data from the two years and then I published the data source directly to a project (folder) that I had previously created on Tableau Server.
Web Authoring in Tableau Server
The time I had to visualise my data with Web Authoring was very limited, this was due to the fact that I:
- Wasted a substantial amount of time, trying to clean data based around the states
- Failed to save my viz whilst trying to build it; resulting in me having to start again with 30 minutes left of Day 4 as there was an error and my workbook crashed
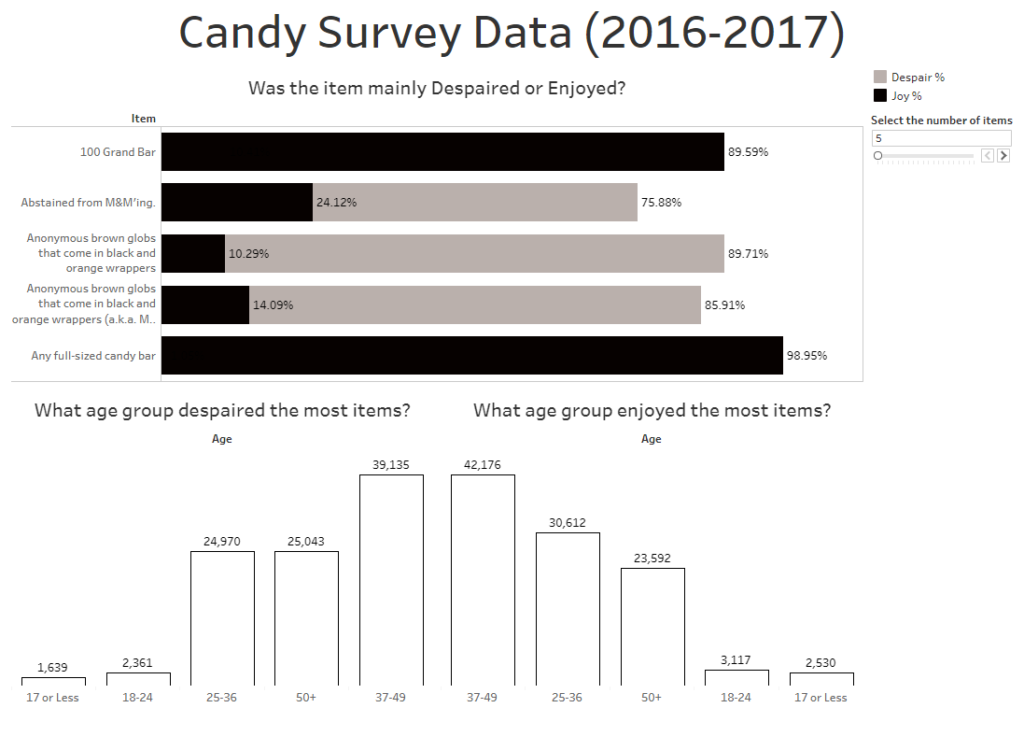
With the limited time I had left, I managed to create a dashboard which showed whether each item was despaired or enjoyed as a percent of total between the two measures. I had a parameter in place to help control how many items you could see in the dashboard as there were 137 in total. At the bottom of the chart I had two bar charts displaying the amount of times different age groups despaired or enjoyed an item.
Overall, I enjoyed using Tableau Prep Builder as its quite easy to clean data that has weirdly formatted words, however Tableau’s Web Authoring function is quite rigid as it does not share the same functionalities as Tableau Desktop, with one of the key limitations being the formatting, as you cannot even change the background colour of the Dashboard.