Today was the start of Dashboard week and our task was to create a visualisation based on reported UFO sightings. We had to web-scrape the data from http://www.nuforc.org/webreports.html and I used Alteryx to do this.
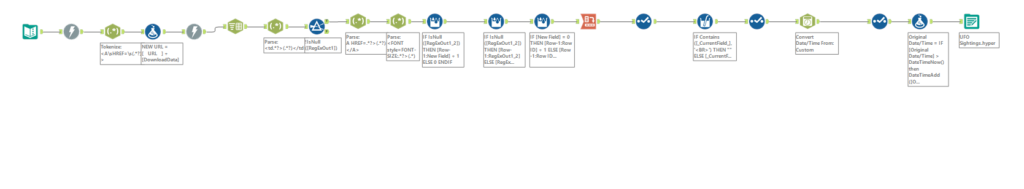
Above is my Alteryx workflow which was used to scrape the website. This consisted of Downloading the Data from one of the main pages then creating a formula to add multiple pages (which were the various years). The multi-row formula was an enemy of mine before today, however the task truly showed me how powerful /useful the tool can be! I also used various RegEx (my favourite!) tools before outputting my data as a Hyper File.
Below is the Viz that I created:
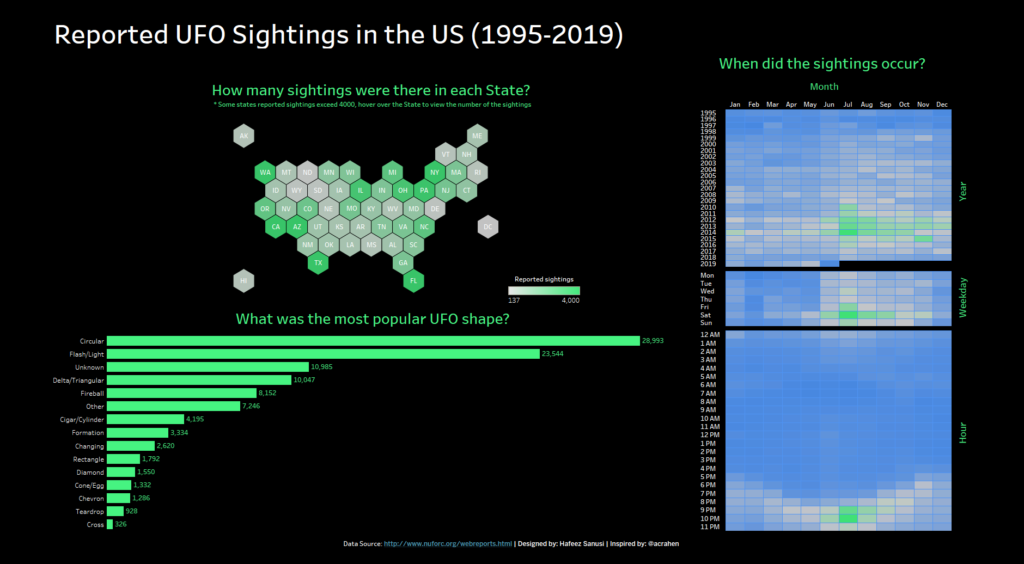
The Dashboard I created was focused on Reported UFO Sightings in the United States between 1995-2019. I decided to create three sections which were based on What?, When? and How many? I also implemented a few actions to allow the user to filter the dashboard by the Location of the sighting, Shape of the UFO and Date of the sighting.
Another productive day at The Data School and a great start to Dashboard week!