There are two ways of calculating top whatever percent of things in Alteryx. Actually, that’s probably not true, there are probably several different ways, each more convoluted than the last, but I have found two straightforward ways of doing it. These examples come from the sample Alteryx data with customers and stores in the US. This is going to get a bit mathsy.

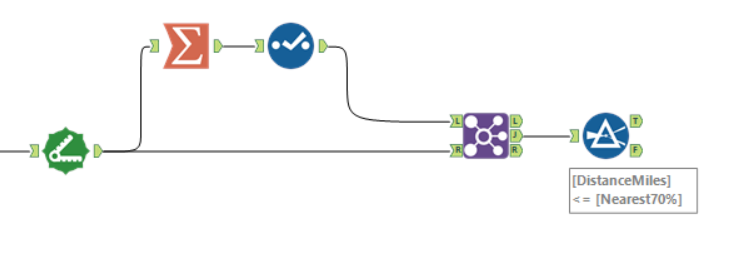
One is to take your dataset, drop a Summarise tool into the workflow, group by a relevant group if necessary, and calculate the (for example) 70th percentile. This gives you the number that represents the 70th percentile of that thing. Then you join the data again, and add a Filter tool with the expression thing <= 70th percentile of that thing. That’s the top 70% of the data by that thing. Boom.
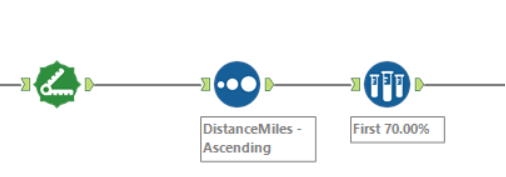
The other, even easier approach is to take your dataset, sort it by distance, drop a Sample tool into the workflow, select “First N % of records”, and type in “70”. You can also group by a relevant group if necessary. That’s the top 70% of the data by that thing. Bosh.
Thing is, they don’t quite work the same.
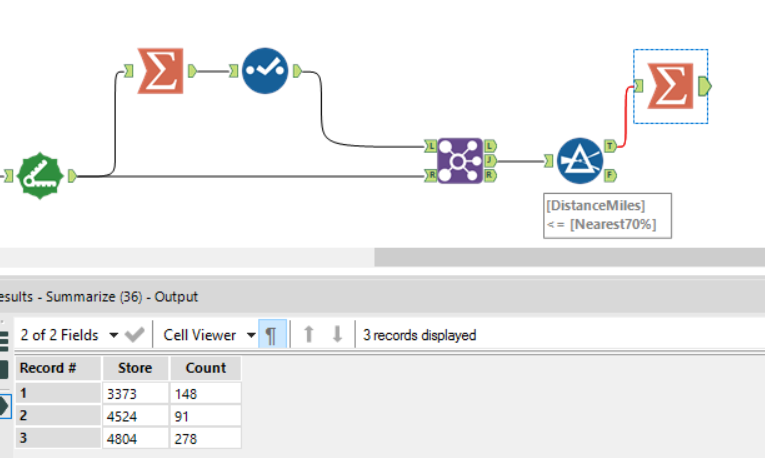
These two approaches take a load of customers for each store, and work out the nearest 70% of customers from those stores. So let’s use a Summarise function to check that the same thing is happening – the number of customers per store should be the same with each calculation.
First, by percentile:
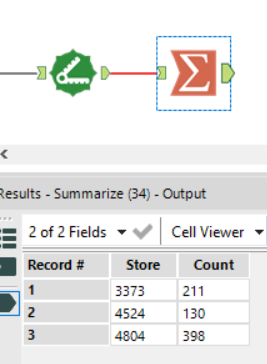
And now by percentage:
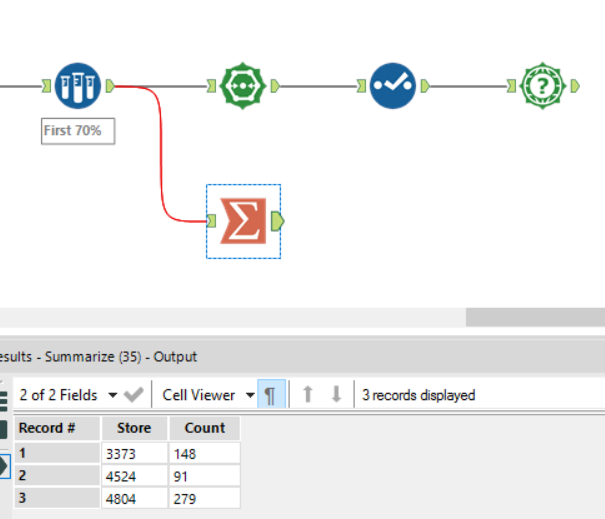
Ah. We have a problem. The nearest 70% of customers to store 4804 numbers 278 by percentile calculation, and 279 by percentage calculation.
Let’s step back a bit and have a look at how many customers in total visit each store.
So, the top 70% of 398 is either 278 or 279. Except it isn’t. 278 out of 398 is 69.85%, while 279 out of 398 is 70.10%.
What’s happening here is that the “summarise then filter by percentile” approach takes everything up to the percentile you specify and no further. If you want it to calculate the 70th percentile, it looks for everything up to 70.0000000. In contrast, the “take top n percent” approach takes everything that rounds up or down to that figure. If you want the top 70%, it includes the top 70.49999999% percent. That happens even if you try to specify “first 70.001%” in the Sample tool.
This has serious implications further down the line. Imagine that your exam grades are assigned by where you fall within your peer group, with an A grade going to the top 5% of students, a B grade going to the next 10% of students, and so on. Students on the border would get different grades depending on the calculation used; if you were in the top 5.2%, then under a top nth percent approach you’d get an A, while under a summarise then filter by percentile approach you’d get a B.
Both calculations are a valid way of doing things, but it’s important to be perfectly clear about which percentage you want to use and why.