One thing I do miss about R is that dplyr and ggplot2 used British (well, NZ) English spelling. Alteryx uses American English spelling, but when you love something, you love it despite its flaws. So it goes for the Summarize tool. We’ve been doing a lot of Alteryx training this week, and I’ve found that when I’m stuck on something, it’s normally because I haven’t used a Summarize tool (I’ve normally been breaking it with a Formula tool instead).
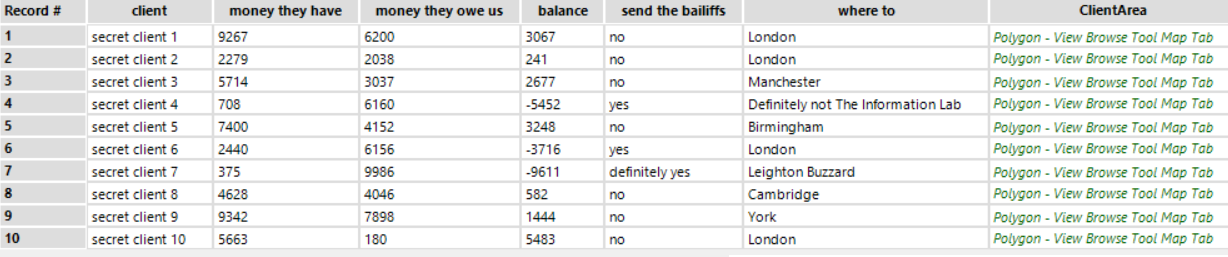
This is a bit like using pipes with dplyr to group your data by a certain variable and then do a calculation. Let’s go back to the definitely real bank data that I have:
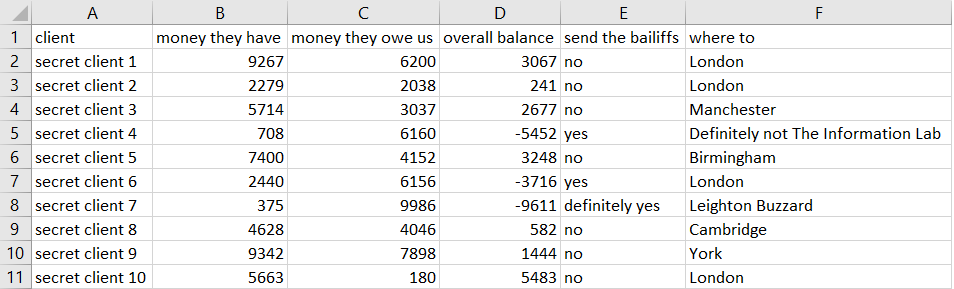
If I wanted to calculate the average balance by client location (which, in this dataset, is the average of the London ones and the values of the others), I’d take the data frame, group it by the “where to” variable, then call a mean function. Like this:
supersecretbankdata %>%

group_by(where_to) %>%

mean(balance)
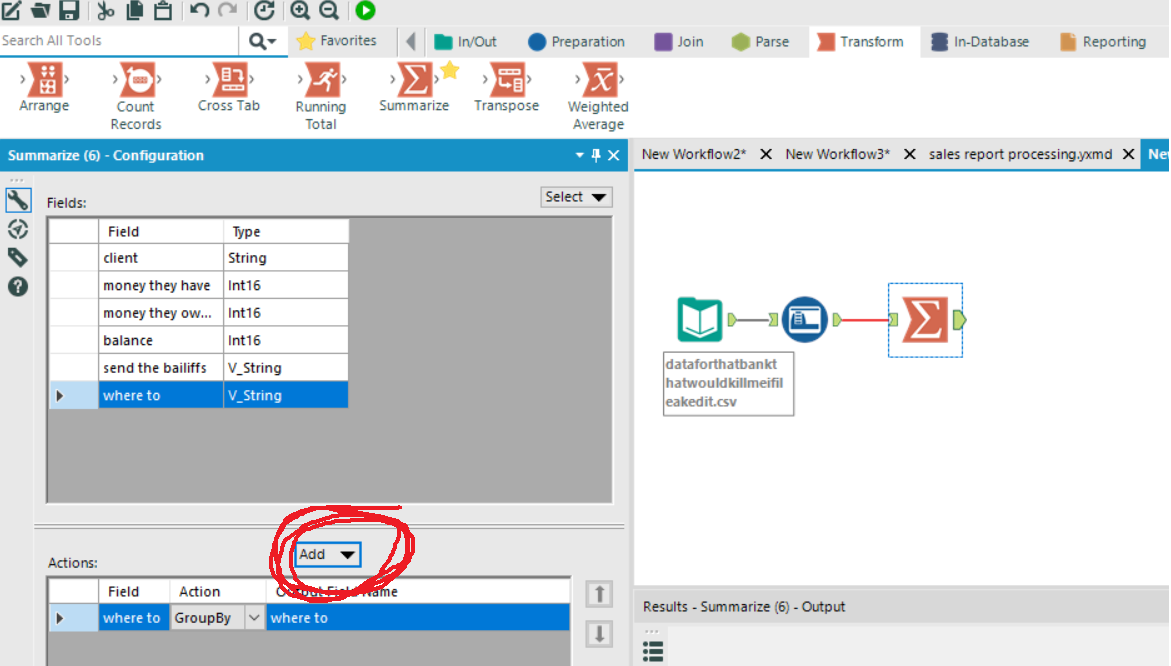
Turns out that it’s basically the same in Alteryx. Drag a Summarize too into the workflow, and click on the “where to” field. Then click Add, and select “Group by” in the menu.
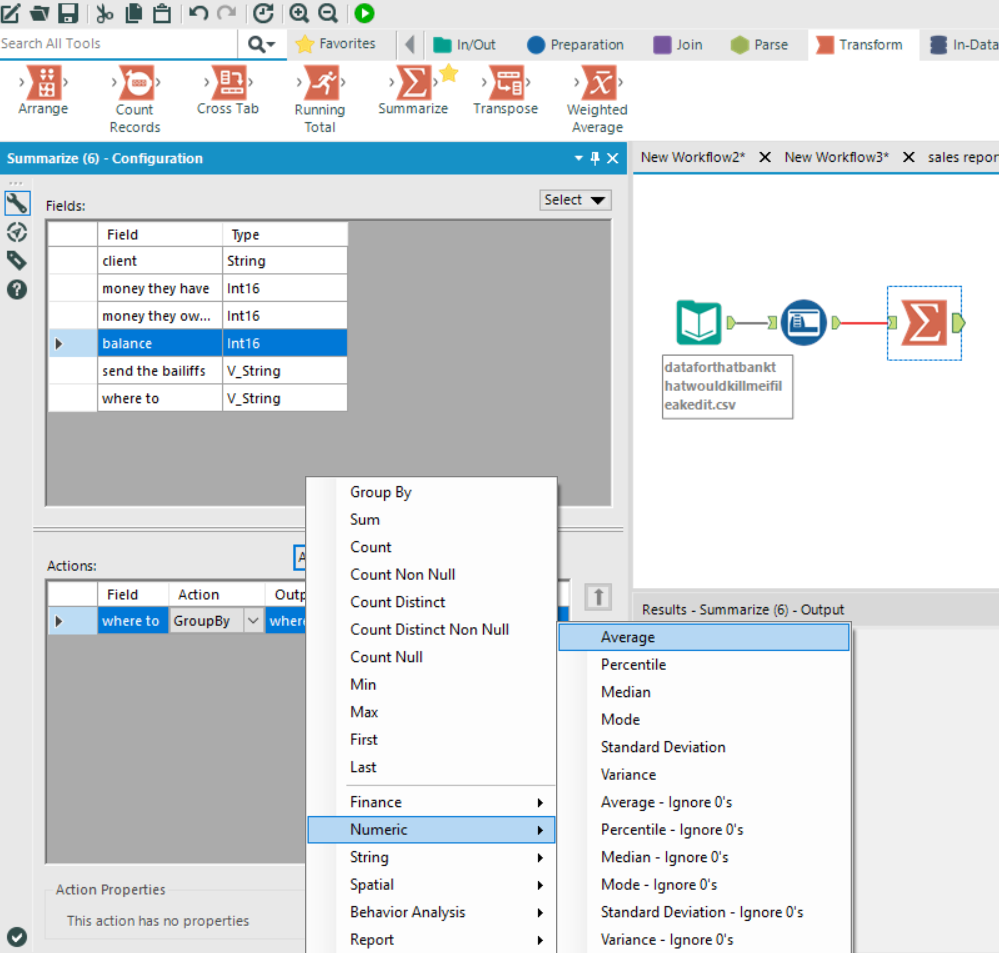
After that, click on the “balance” field. Then click Add, and this time select the numeric and average options in the menu.
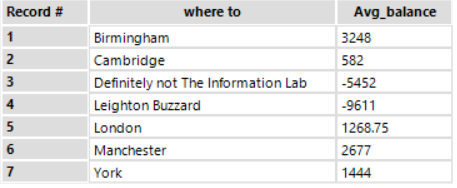
And that’s it. Run the workflow, and it calculates the average balance by location:
Ah, you might say, that’s an easy example, quit copping out of writing a proper blog by just commentating on something that’s really straightforward. Fair point. Summarize also covers other functions where you’d want to do something like putting a function inside an sapply().
Let’s say that we’ve got data that gives us a 100 metre radius around the offices of each client, just in case we need to cordon off and storm the area if they’re late with their payments. These are stored as polygons of linked latitude and longitude points.
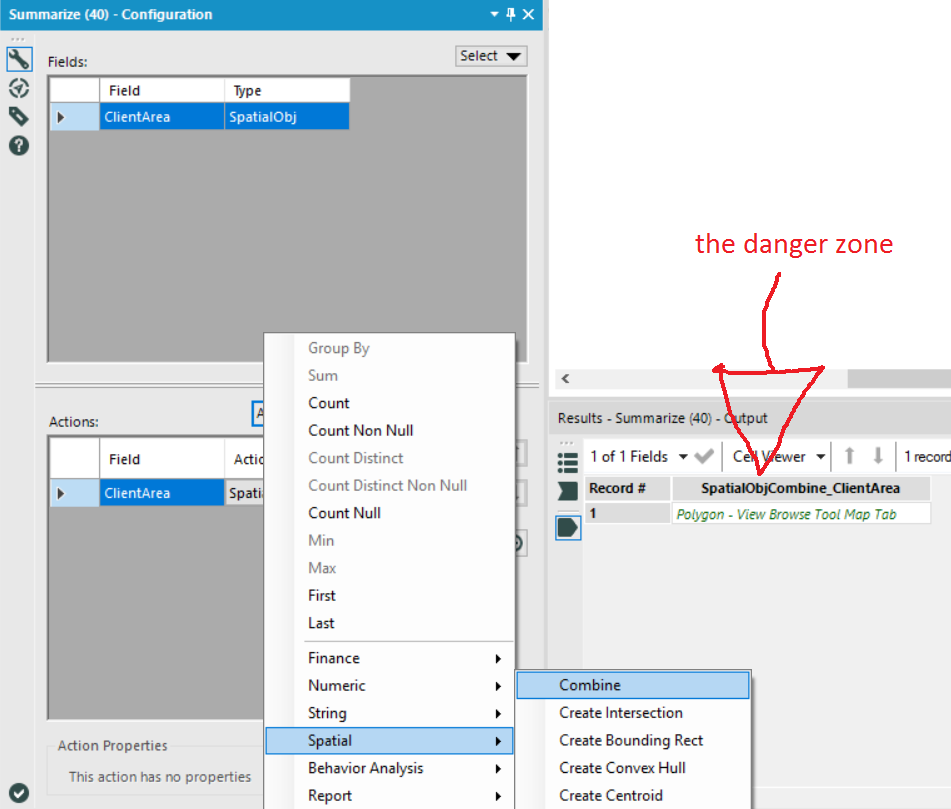
With Summarize, we can calculate the total area that would be affected if we decided to attack all our clients at once. All you have to do is drag a Summarize tool onto the workflow, click on ClientArea, click add, go to Spatial, then click Combine. This creates a single polygon of the combined danger zone area.

Summarize is great, and endlessly useful. However, the one drawback is that it’s not fully customisable – it’s not possible to write your own macro and then use that as a Summarize action. But there’s still more than enough that you can do with it to make it one of my favourite tools in Alteryx so far.