This is a quick example to visually illustrate how sets overlap and can be combined to create combined sets.
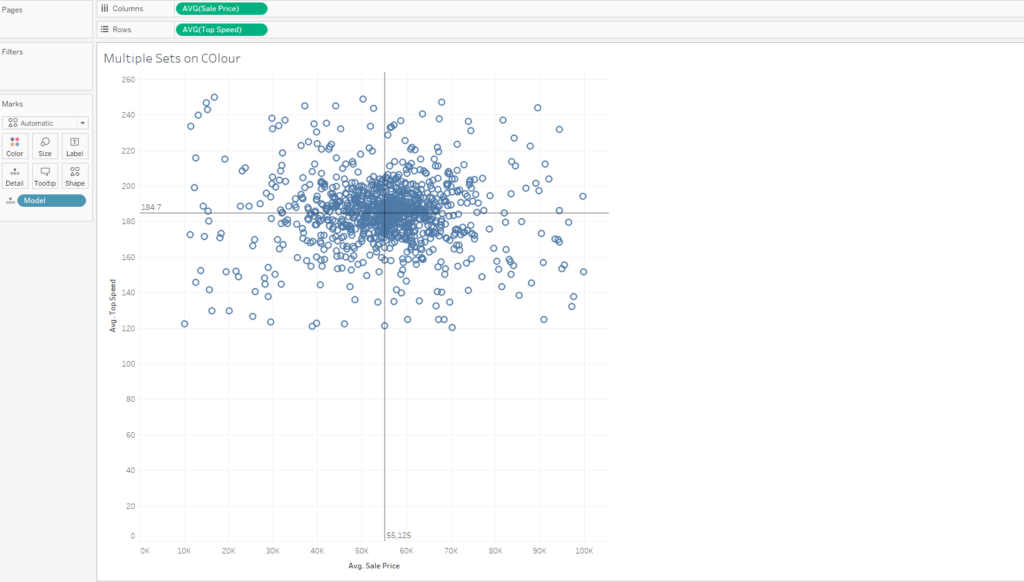
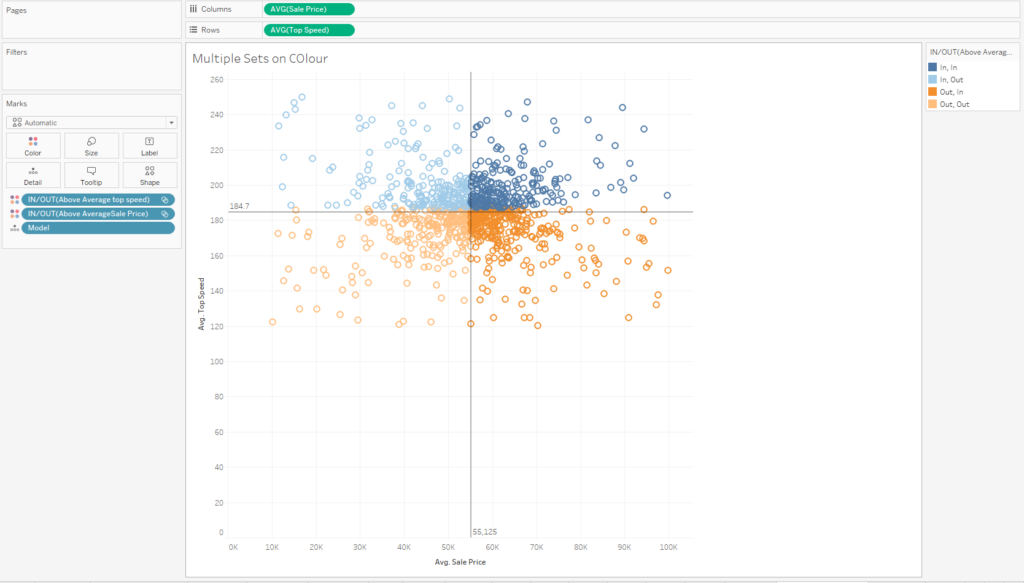
I’ll be using a sample car sales data set with average top speed (on rows) plotted against average sale price (on columns) for different car models (on detail). We can see the average top speed of 184.7 and sale price of 55,125 with the aid of some reference lines, which divide our view into quadrants. But what if we want to split the quadrants into different colours, or to isolate them to work with individually?
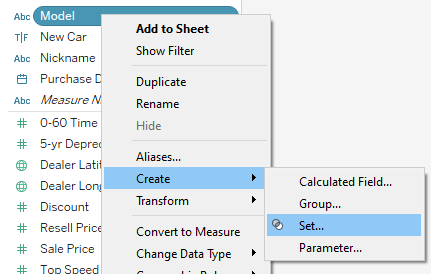
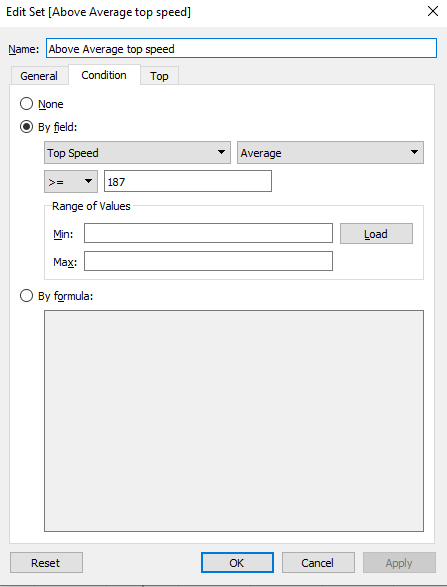
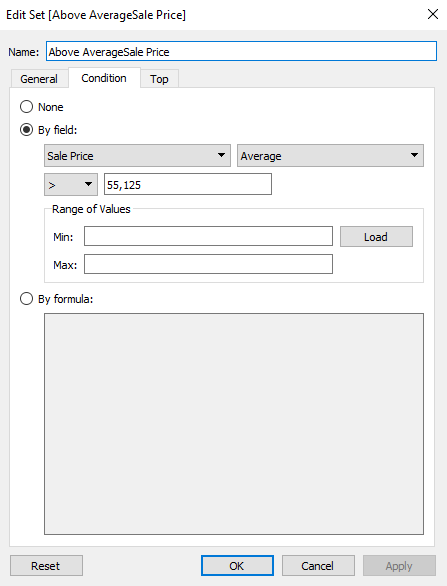
To do this we can create a pair of sets based on condition. I right click on the Model field in the data pane and select create set, then configure them to be above or equal to the respective average values from above.
Dragging both of these sets onto colour creates four conditions within the view,. The conditions are based on the combination of the sets, and the marks are coloured accordingly. These conditions are:
In, In
In, Out
Out, In
Out, Out
So we have succeeded in identifying and colouring our four quadrants, but what if we want to isolate them individually for further further use? This is where combined sets come in.
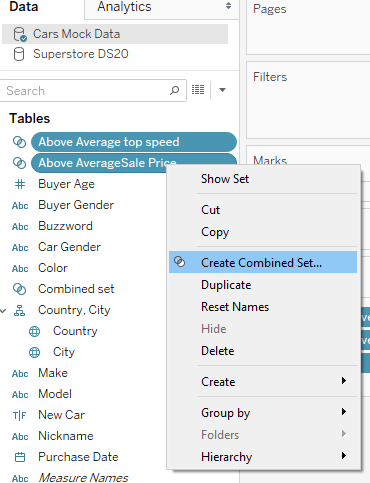
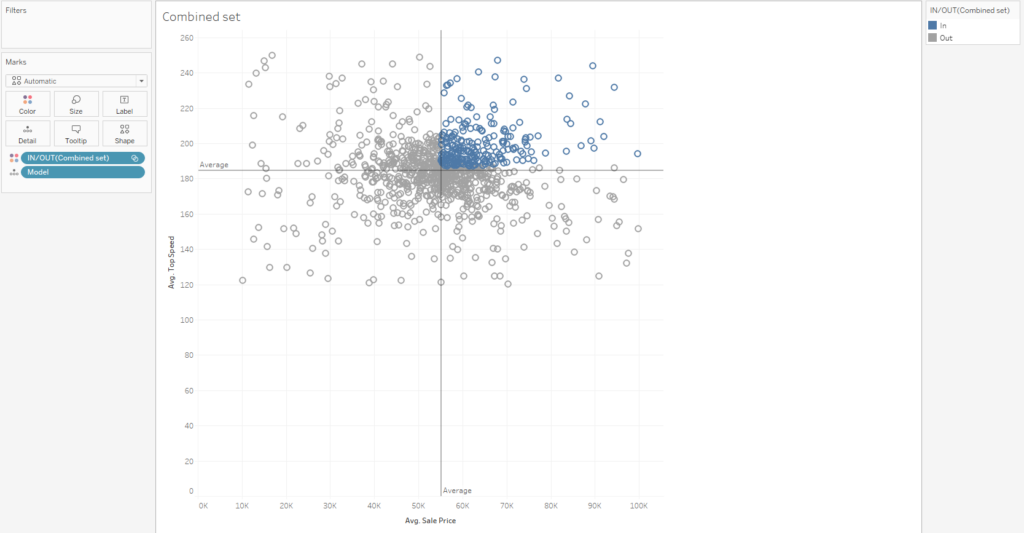
If we select both sets at once within the data pane (click on one then Ctrl+click on the other), then right click on the selection, we have the option to make a combined set. Clicking this brings up a new window with venn diagrams, which allows us to specify how the sets should be configured to create the combined set.
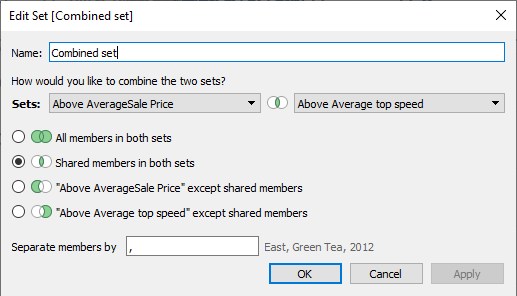
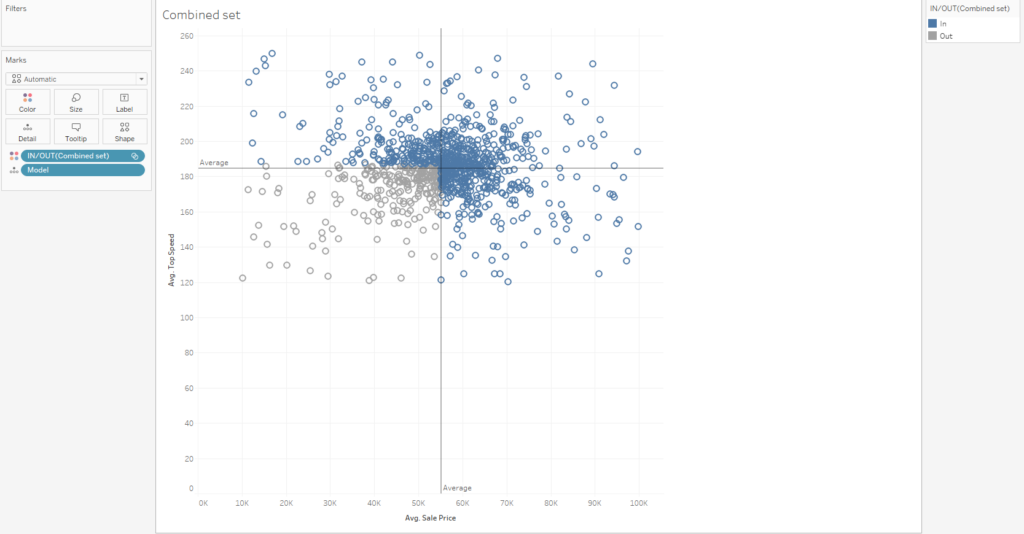
For the first option “All members in both sets”, Where sets overlap: this takes all the members that are in at least one set. Referring back to our colour quadrants above, this essentially combines quadrants in which the word “In” appears.
In, In
In, Out
Out, In
The second option “Shared members in both sets” requires that members are in both sets (they are above the average sale price and above average top speed. So only the upper right quadrant
In, In
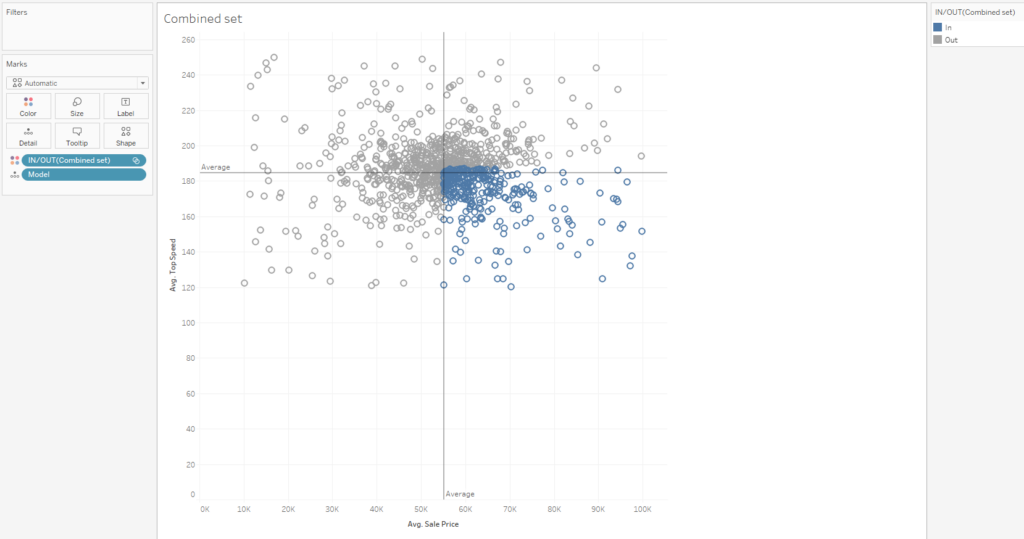
For the ‘”Above Average Sale Price” except shared members’ option we can isolate the bottom right quadrant – i.e. members that are ‘Out’ of the above average top speed set but ‘In’ the above average sale price set.
Out, In
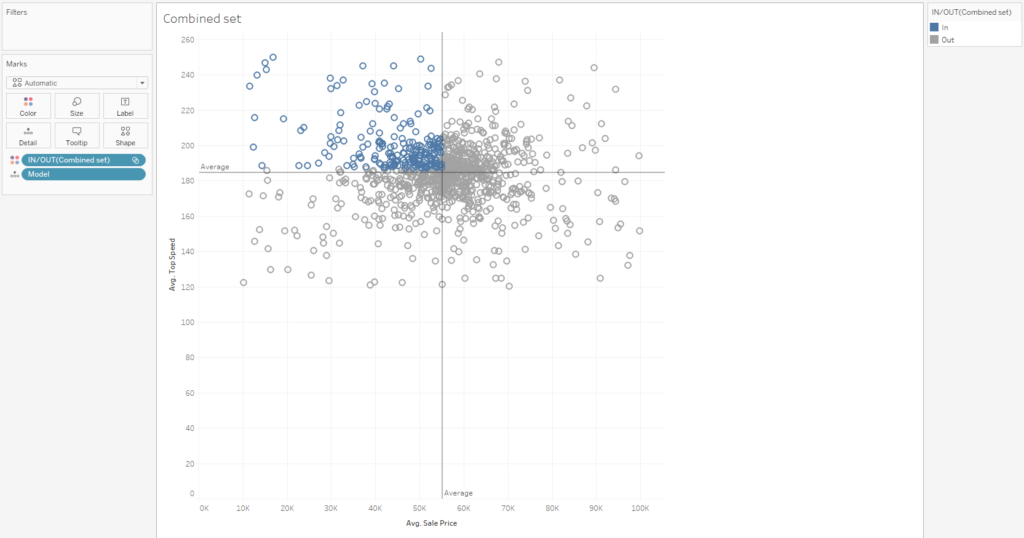
And finally with the ‘”Above Average Top Speed” except shared members’ we can perform the analogous operation to isolate the upper left quadrant.
In, Out
And that’s all folks! To isolate members of the final remaining condition ‘Out, Out’ we could configure our combined set as “All members in both sets” (the first venn diagram option) and refer to members not in it, for example in a calculated field:
IF NOT [Combined set]
then ‘Out’
END