Today our project was to create some KPI dashboards for the C-level and Analyst level using data on Kickstarter projects.
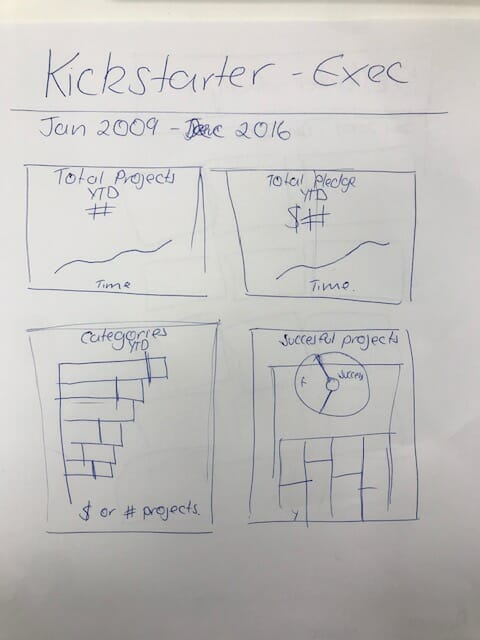
After downloading and looking at the data the first step was to draw out ideas for the dashboards. Below are my rough sketches. I wanted to focus my executive dashboard on four main areas and see how these have changed over time –
- The number of projects
- The amount that has been pledged
- The project categories that have the greatest amount of pledging
- The successful projects compared to the unsuccessful (projects who met their financial goal and those that didn’t)
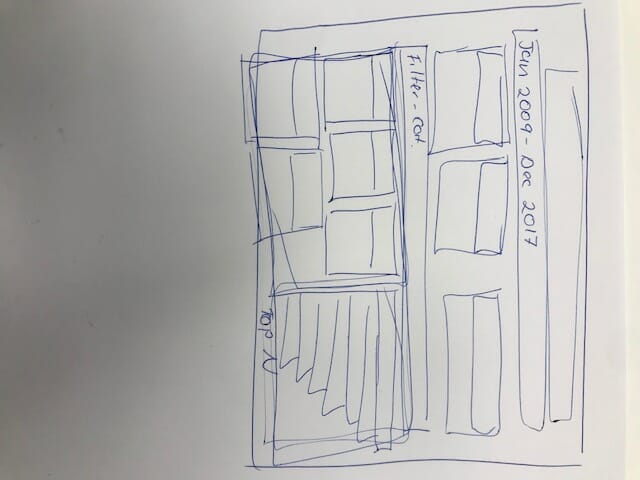
For the analyst dashboard I wanted to go a level further that allowed the analyst to look at the specific projects across these metrics.
As I have learnt so far, each day comes with it’s own challenges! Today’s was using dates and working out YTD calculations….but like the first two days I have learnt a lot in a short space of time.
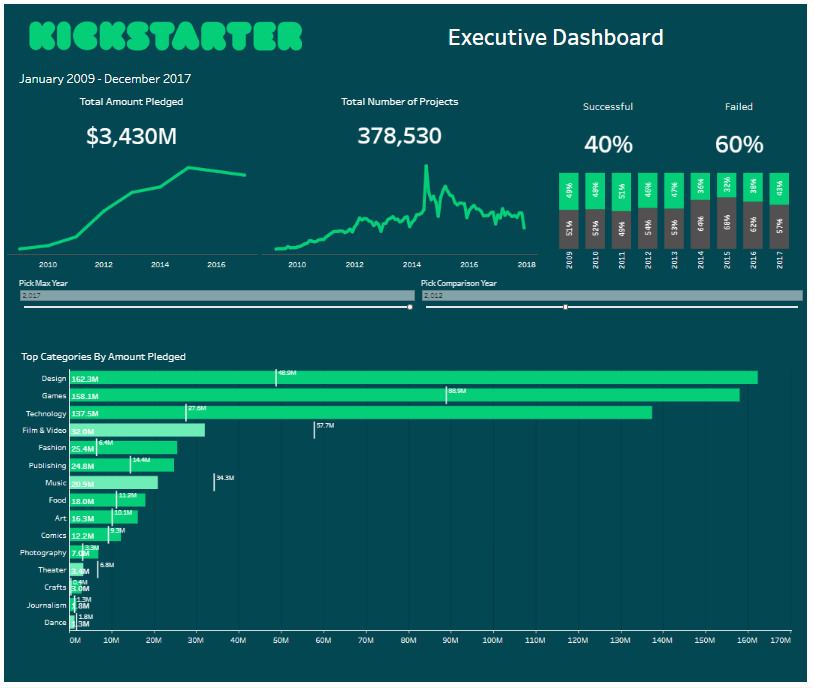
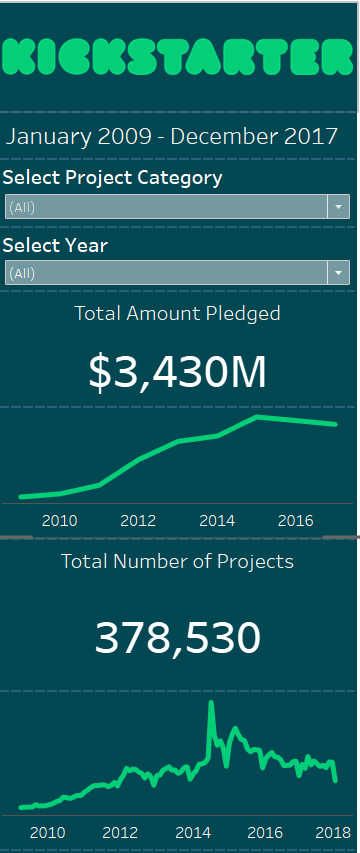
Below are my final dashboards –

Day 3 done and dusted 🙂