For the third day of dashboard week (which was in fact my first after missing the first two) we had to use Tableau Public Web Edit to visualize data about the bike counters placed along different routes in Seattle - you can find the dataset here.
I downloaded the data for 7 out of the 12 locations and went into Alteryx to clean it and prepare it for Tableau. My flow looks something like this:
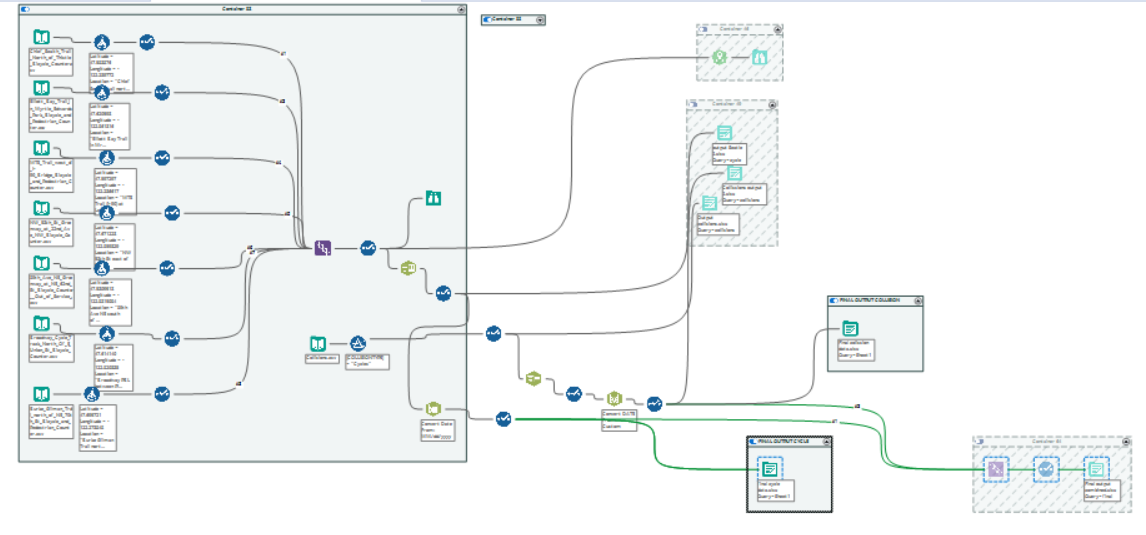
The initial idea was to add coordinate information to each of the locations listed on the Seattle.gov website. Then I decided to only look at the total number of bicyclists recorded in all directions, in one hour.
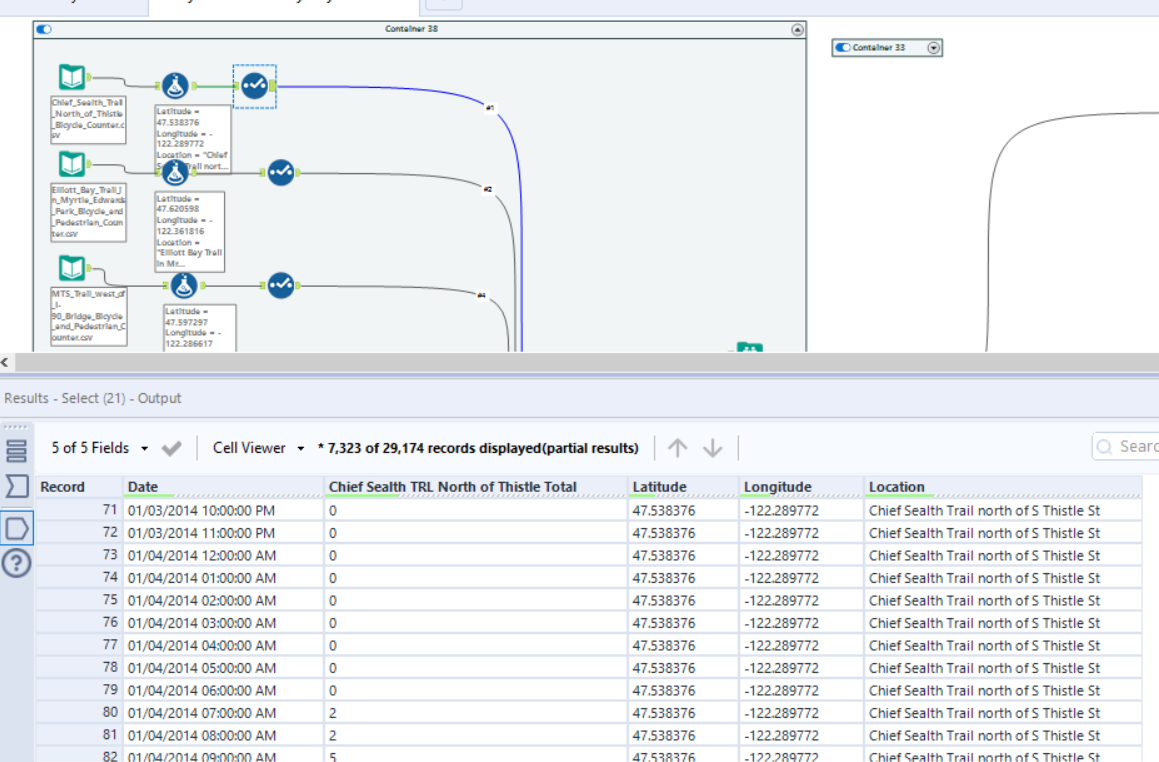
In the end, all the 7 files looked like this. I then used Union by position to bring all the files together.
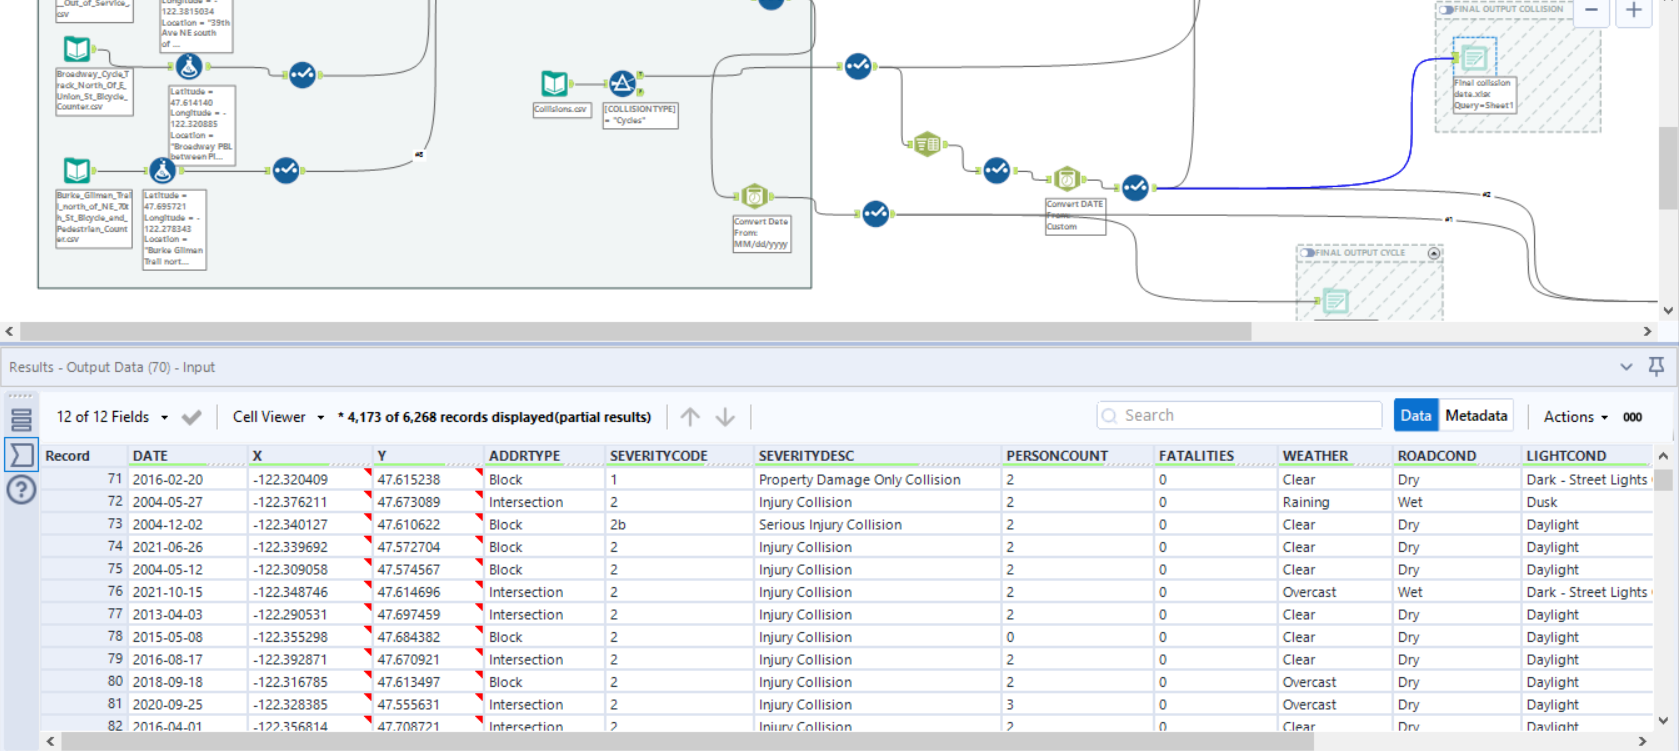
At this point I decided that I want to add additional data to my analysis so I downloaded the Collision data from Seattle from here; After some cleaning I ended up with this output.
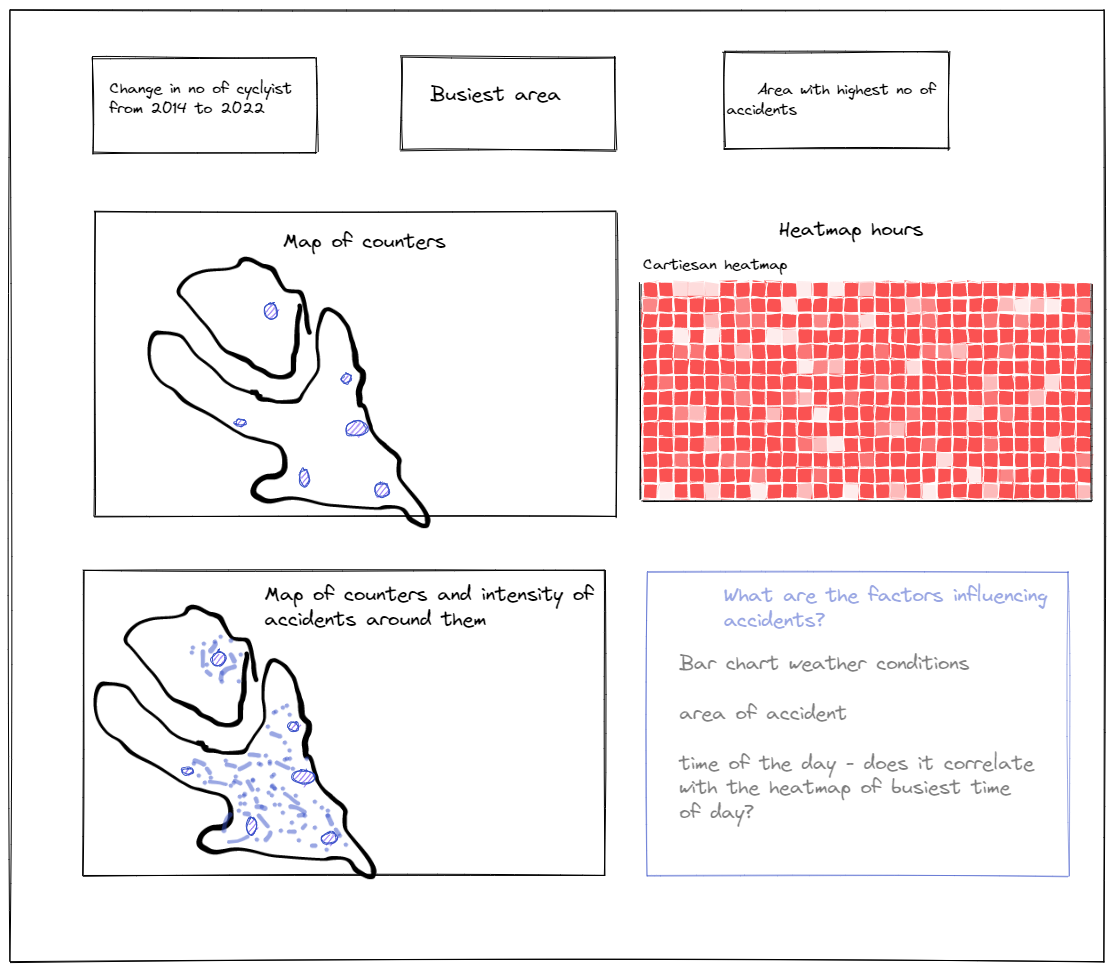
Now onto the dashboard - my initial sketch looked like this:
I started working on recreating some of the charts in the sketch from 1.30pm until around 3pm when my Tableau Public crashed and I lost all my work..
So the most important thing I've learnt today is that Web Edit does not automatically save your progress as Tableau Desktop does. So if you ever decide to create anything on Tableau Public make sure to regularly click Publish to save your work!
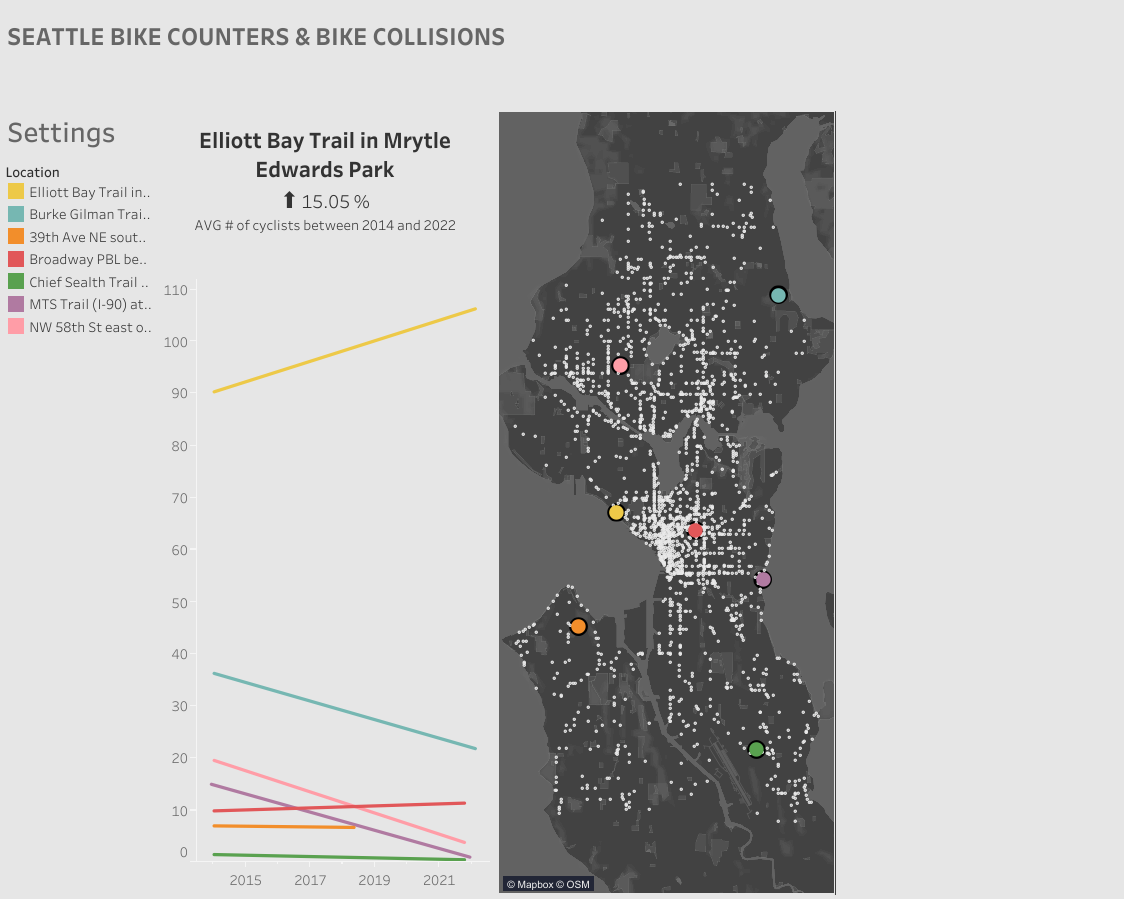
In the end, I powered through recreating some of the bits I lost and I managed to create this in about 40 minutes.. Even if it's not the dashboard I envisioned in the beginning, I'm still quite happy I got to learn some lessons from today.