Another day, another API, and another dashboard… today we were tasked with food data! Figuring how to get one source of data for a single location was not so bad but to generate that across all locations required a bit more work.
Using Alteryx we manipulated the parameters in the API URL so that we could access records across all pages using the generate rows tool. This tool essential replaces the page number and adds 1 every time to source the next page of data. By using the download and XML parse tool we could now see most of the data structure which just required a bit of tinkering in Regex.
Alteryx Workflow
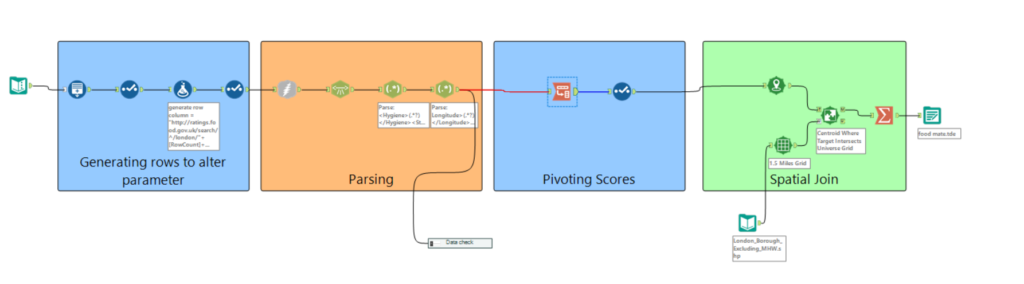
I also wanted to use a separate shapefile to map out geocodes in our data which I was able to do by using Alteryx’s spatial tools to create a grid map of London. Thanks to Andy Kriebel for his lesson in London Crime!
Everything seemed to be going well and I had the right amount of records. However, when I then started exploring the data in tableau I had duplicate records for business names, clearly, something was wrong. So I had to look back into my workflow and figure out where they were dropping out. After my parsing, I was getting the same unique amount of records as in tableau so the issue had to be before then. Eventually, I realised that I was downloading from the original URL and not the one that was being updated by the generate rows tool. So although I was getting the right amount of records I couldn’t see the duplication in my workflow. For future reference when things go wrong with your workflow I would advise to start all the way from the beginning and break it down step by step to avoid any little mistakes!
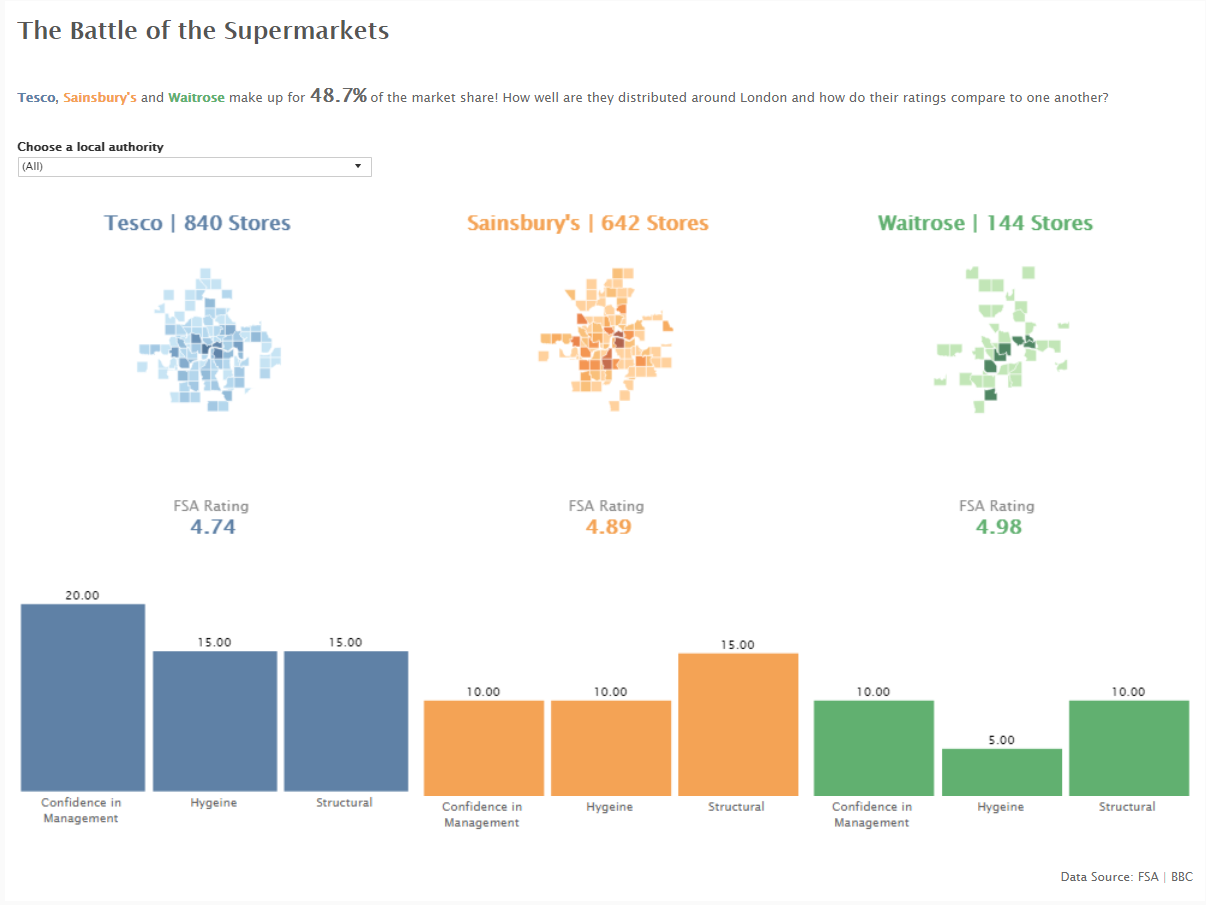
Dashboard time and I thought I’d hone in on the big supermarkets and compare them to one another based on the FSA ratings and scores. Check out the viz to find out more!