


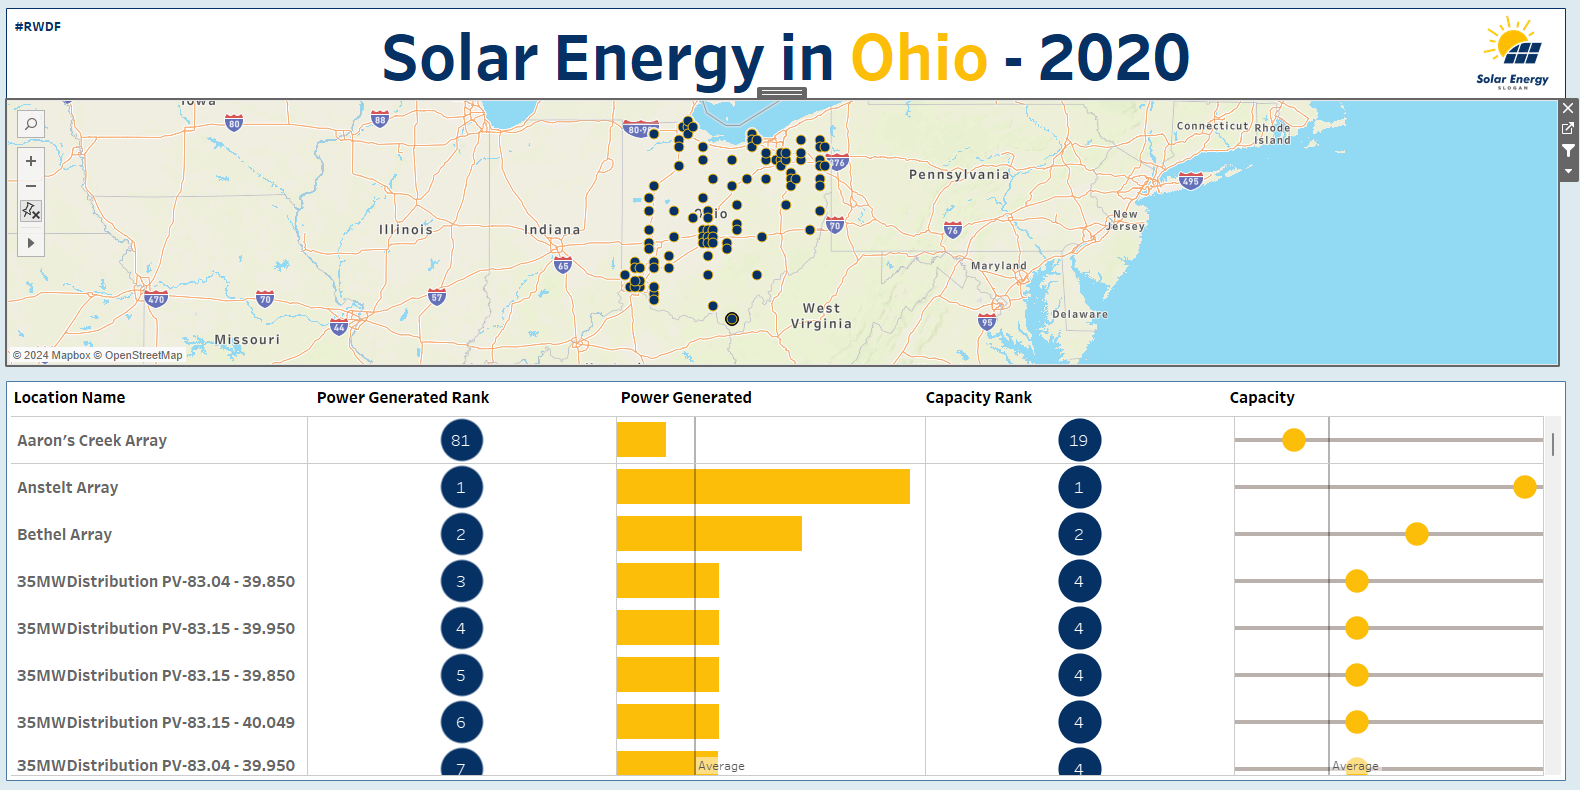
Especially in exploratory Dashboard, including tables can be useful. However, in some cases, the table on the dashboard only shows a sample of the data. Here, you can use a scroll to find the relevant data. There is also the option to use set actions to connect the table to other graphs, which enables the relevant data points to skip to the top of the table without filtering out the other values. Let’s have a look at an example of a RWFD Solar Energy project (see below).
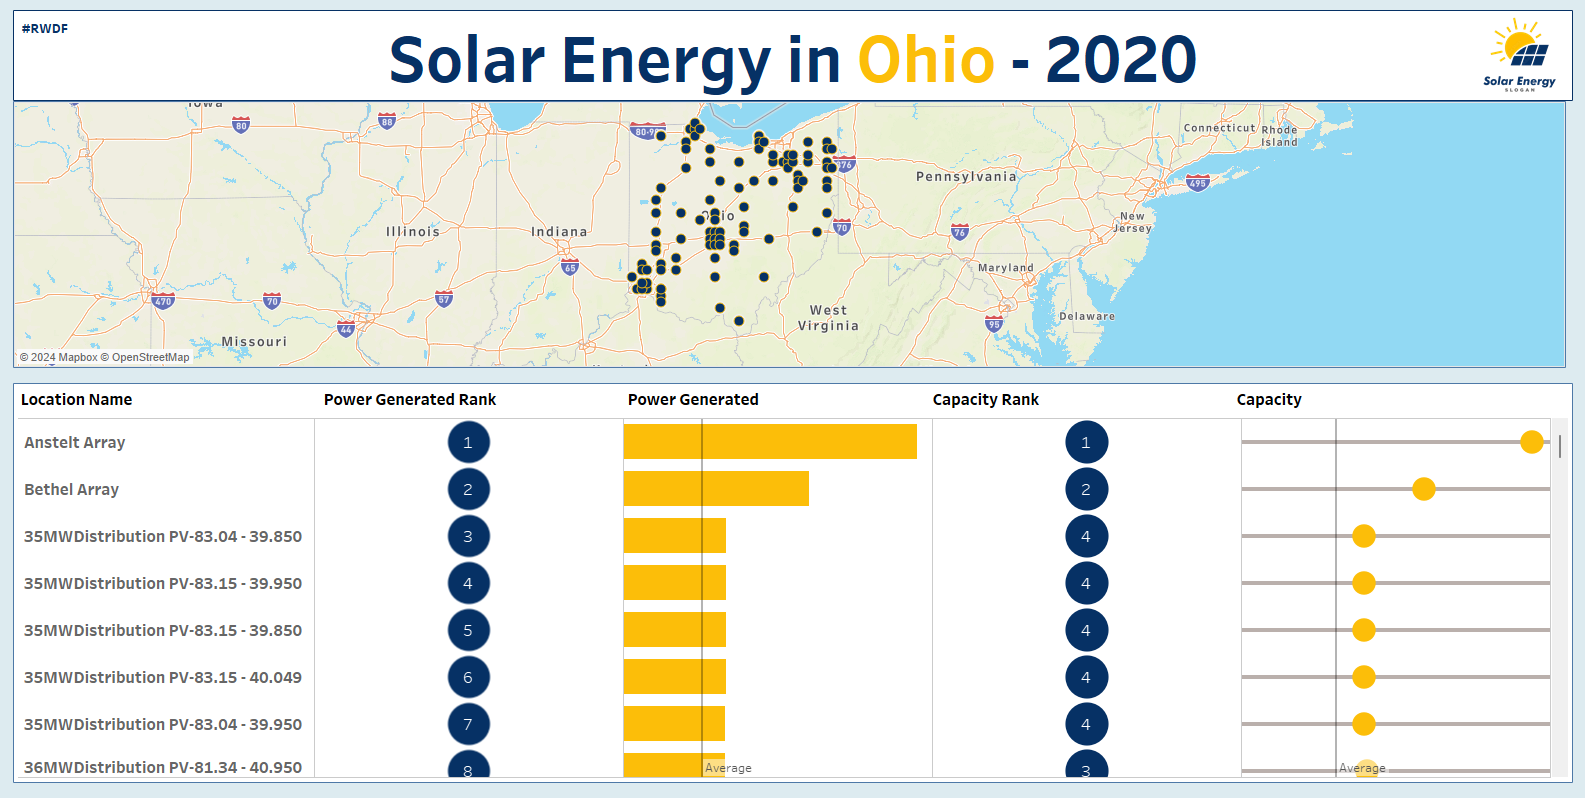
The goal is to select a project on the map and have it jump to the top of the table.
This is how it works:
- You create a set of the desired dimension, choose the general option and choose all. Right click on dimension → create → set → general → select all
- Drag the newly created set and drop it in rows in front of the over dimension(s).

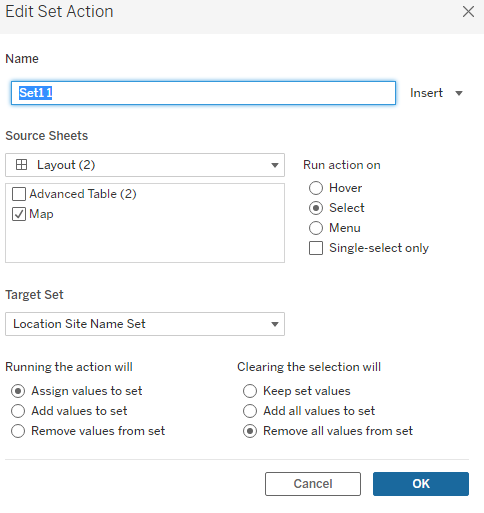
- Now go to your dashboard and select actions. Add a new action and choose Source sheet (Map), the target set, your desired run action, and what will happen when selection is cleared just like you see below.
Et voilà! Your set action has been completed.