This week at Data School we are continuing our Alteryx training, and as part of this we have been working through Alteryx’s Weekly Challenges (you can find them here).
One of the challenges I looked at was Week 14 on retail distribution analysis. The data was in 3 different files providing:
- Store location and priority details
- Store and item details
- Warehouse and item availability details
The objective was to distribute items to stores based on store priority and warehouse availability.
There are a couple of different ways to solve this challenge including using an iterative macro, but I chose to use a tool I had never used before, the Multi-Row Formula, to complete the main part of my analysis. This is how I did it:
Step 1: Join the data files
The first step is to join the three data files together. To join the files there needs to be a common field between them. In this case there is a common field between file 1 & 2 and then between 2 & 3. Therefore, I joined files 1 & 2 on the Store field first, then joined the outcome to the third file on the Item field.
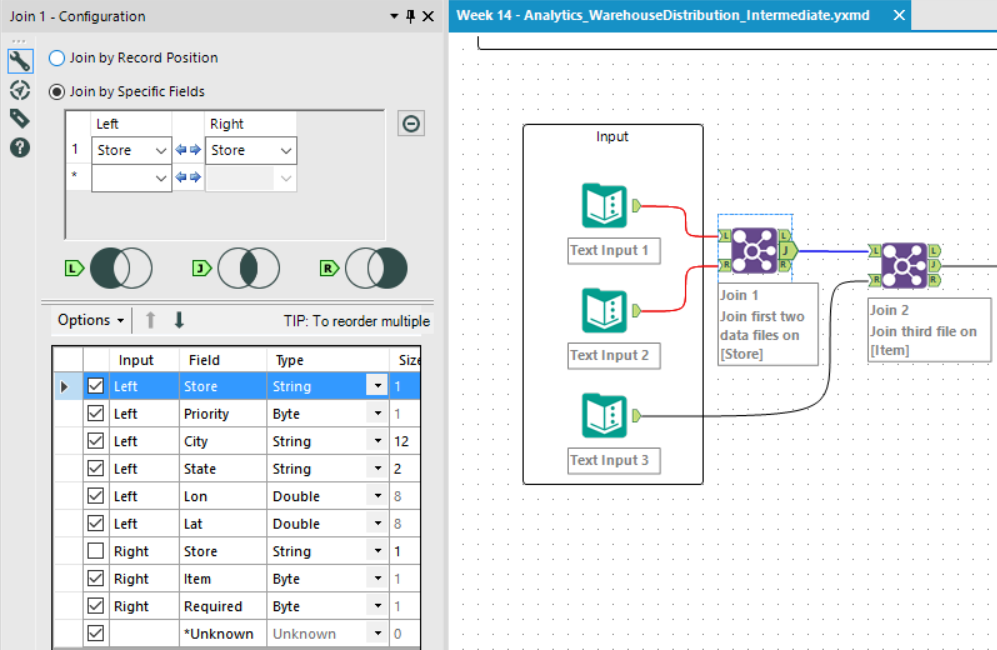
At this point I deselected any fields that were present in both files so that I wouldn’t have any duplicated fields.
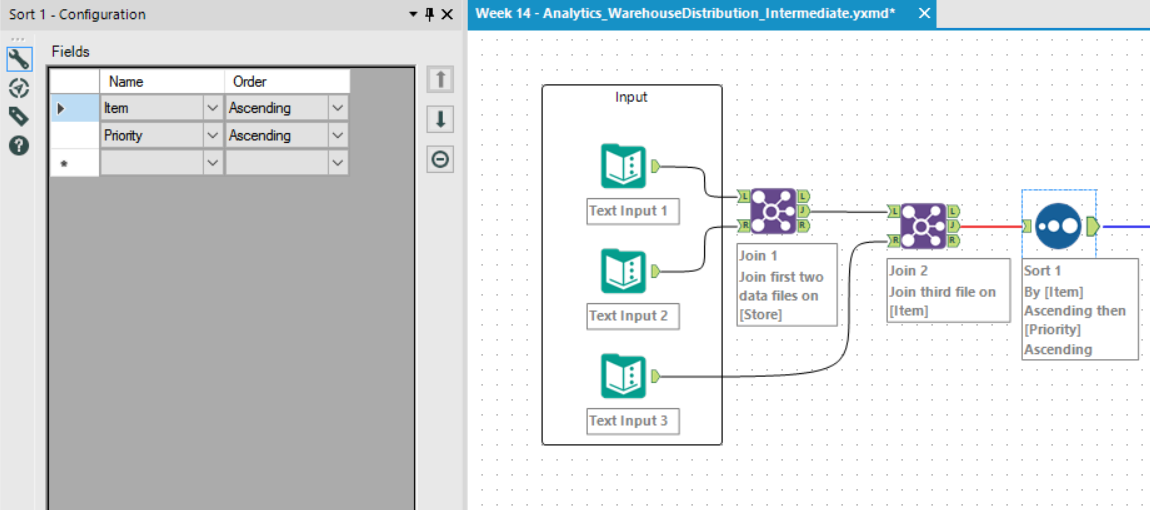
Step 2: Sort
The data needs to be analysed by priority so that the warehouse knows where to distribute each item, so I used the Sort tool to sort firstly by Item, then by Store Priority. This means that all the items are grouped and then listed in ascending store priority order.
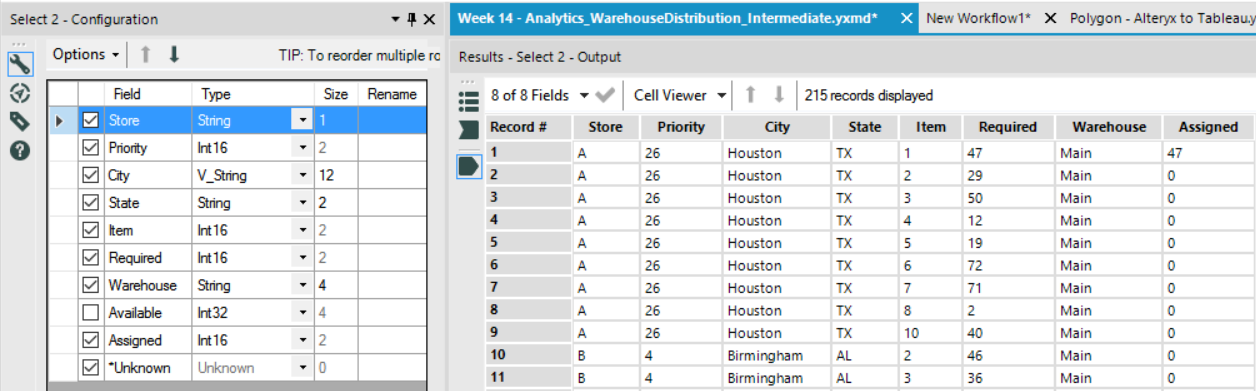
Step 3: Select
Next, another simple step to change the types of the numerical fields so that I can use them in my analysis, and a bit of renaming using the Select tool.
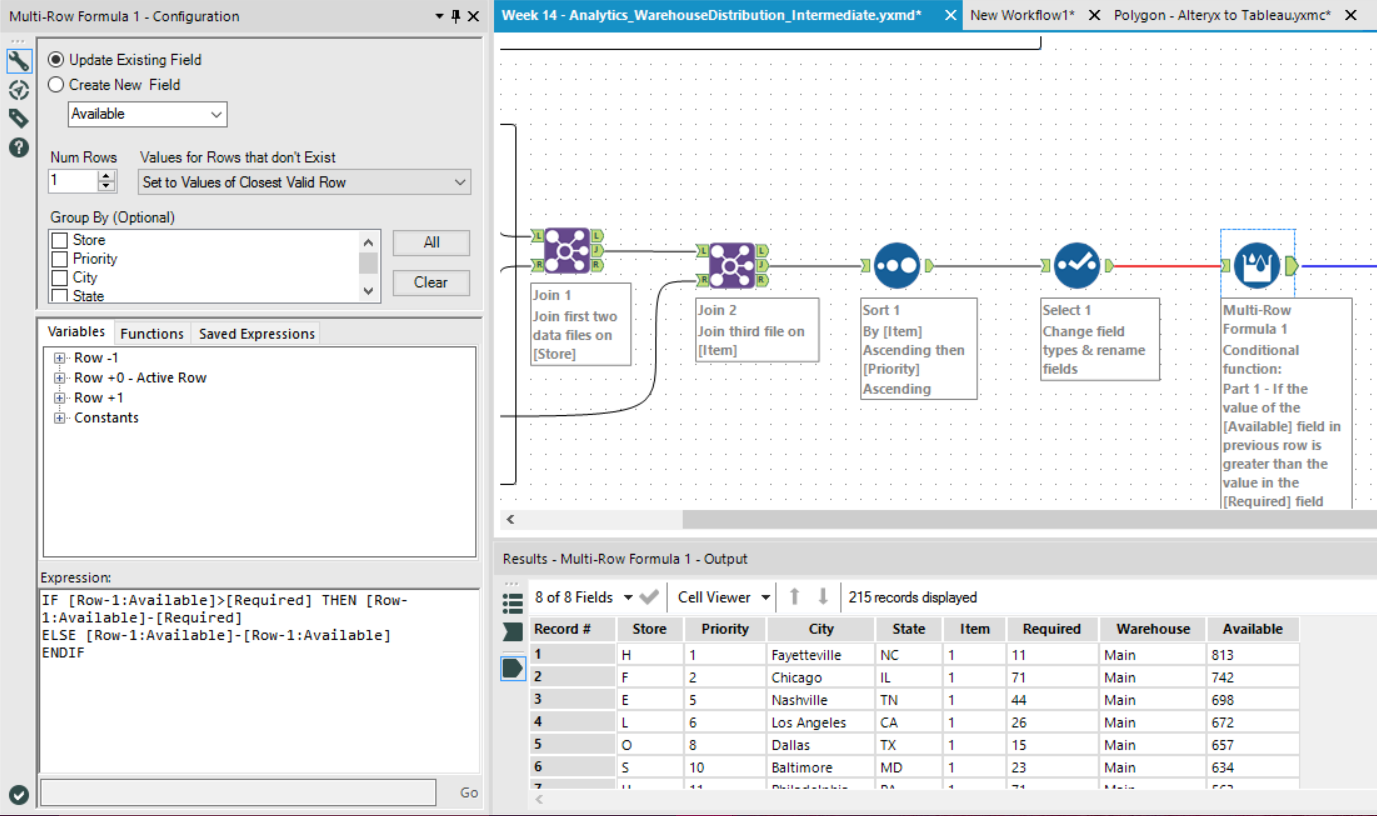
Step 4: Multi Row Formula
The multi-row formula tool is pretty self-explanatory; it lets you use multiple row data within your formula, i.e. one example of this is creating a formula to point Alteryx to the previous row or subsequent row compared to the ‘active row’. When you use this tool you have the choice of either updating the current field or creating a new field, where you can then set the field type. It is very useful for creating running totals and other mathematical calcs.
In this step I needed the Available field to update according to how many Items are remaining (available) after the previous store has taken (either their required amount, or the amount remaining), and to see how many (if any) of that Item can be distributed to the next store. Therefore, I effectively needed a running total of the remaining number of Items available. At this point you could use the Running Total tool, but because I hadn’t used a Multi-Row Formula tool before I decided to use one here.
The formula in this tool needed to look at the Available amount of Items, and if that amount is greater than the Required amount in the following row, to assign the Required amount of Items to that row, OR assign the amount remaining in the Available field. I used a conditional formula to do this:
Part 1 – If the value of the Available field in previous row is greater than the value in the Required field then subtract previous Available value from Required value.
Part 2: Otherwise subtract the previous Available value from itself.
The output from this formula is the decreasing value of the items available.
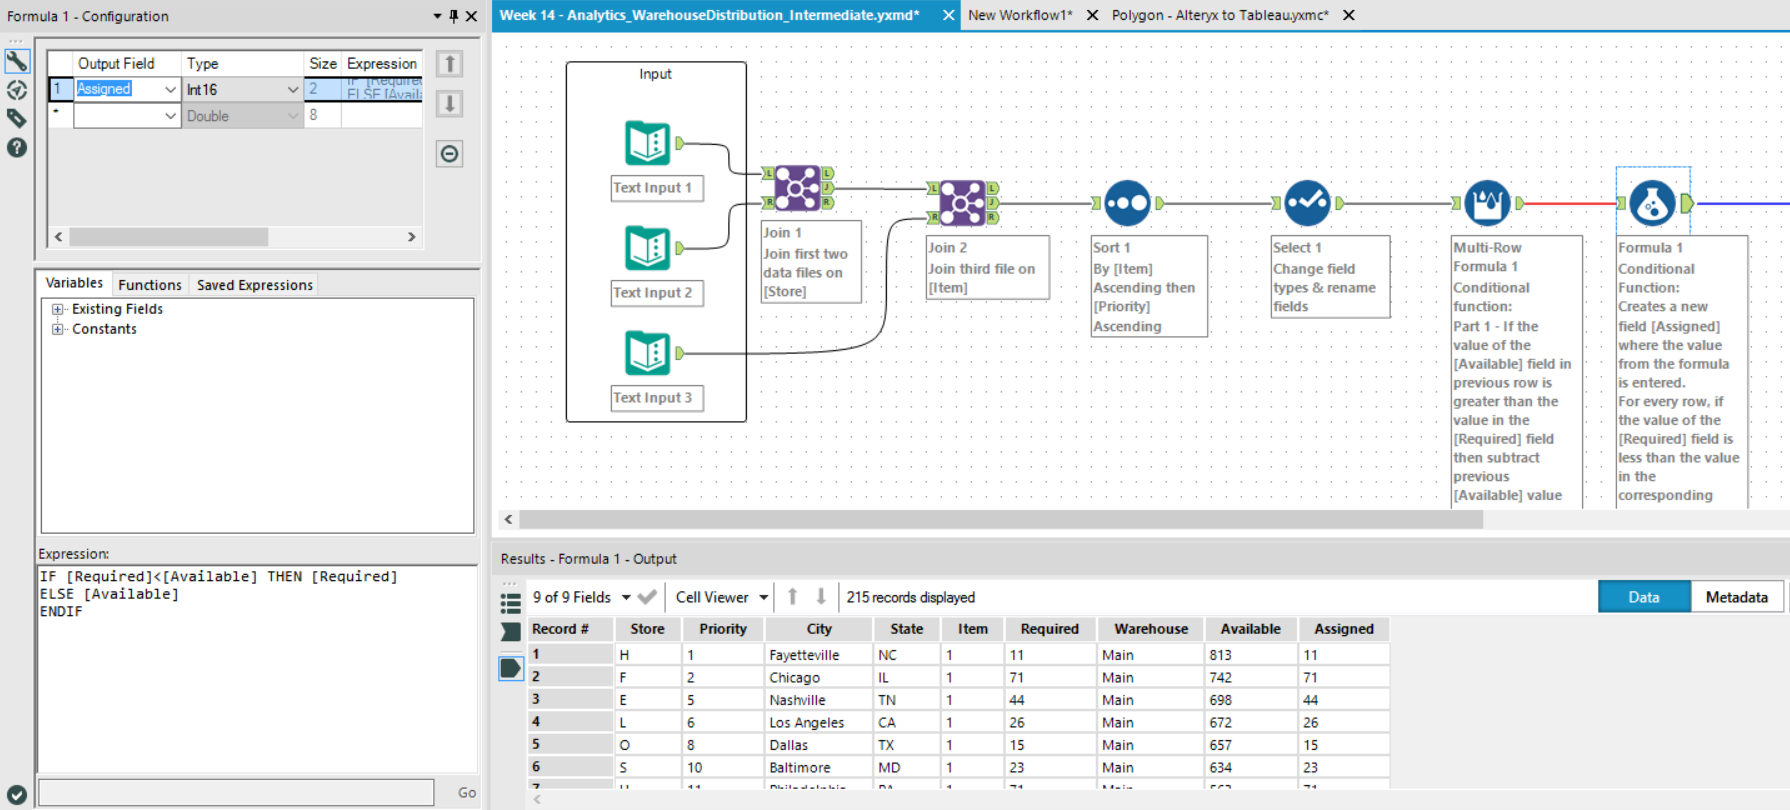
Step 5: Formula
The next step was to create a new field to calculate the number of Items that will be distributed / Assigned per Item type per store. I used a normal Formula tool here because I did not need this calculation to look at multiple rows, just multiple fields.
For this step I used a conditional function to subtract the Required amount of Items from the Available amount, IF the Available amount is larger, otherwise, just return the Available amount.
Step 6: Sort
The next two steps are just tidying up the data; sorting (Ascending alphabetically by Store and by Item)…
Step 7: Select
…And then just selecting the fields to output.